29
/
en
AIzaSyAYiBZKx7MnpbEhh9jyipgxe19OcubqV5w
April 1, 2024
118877
Denmark
DNK
true
2
1
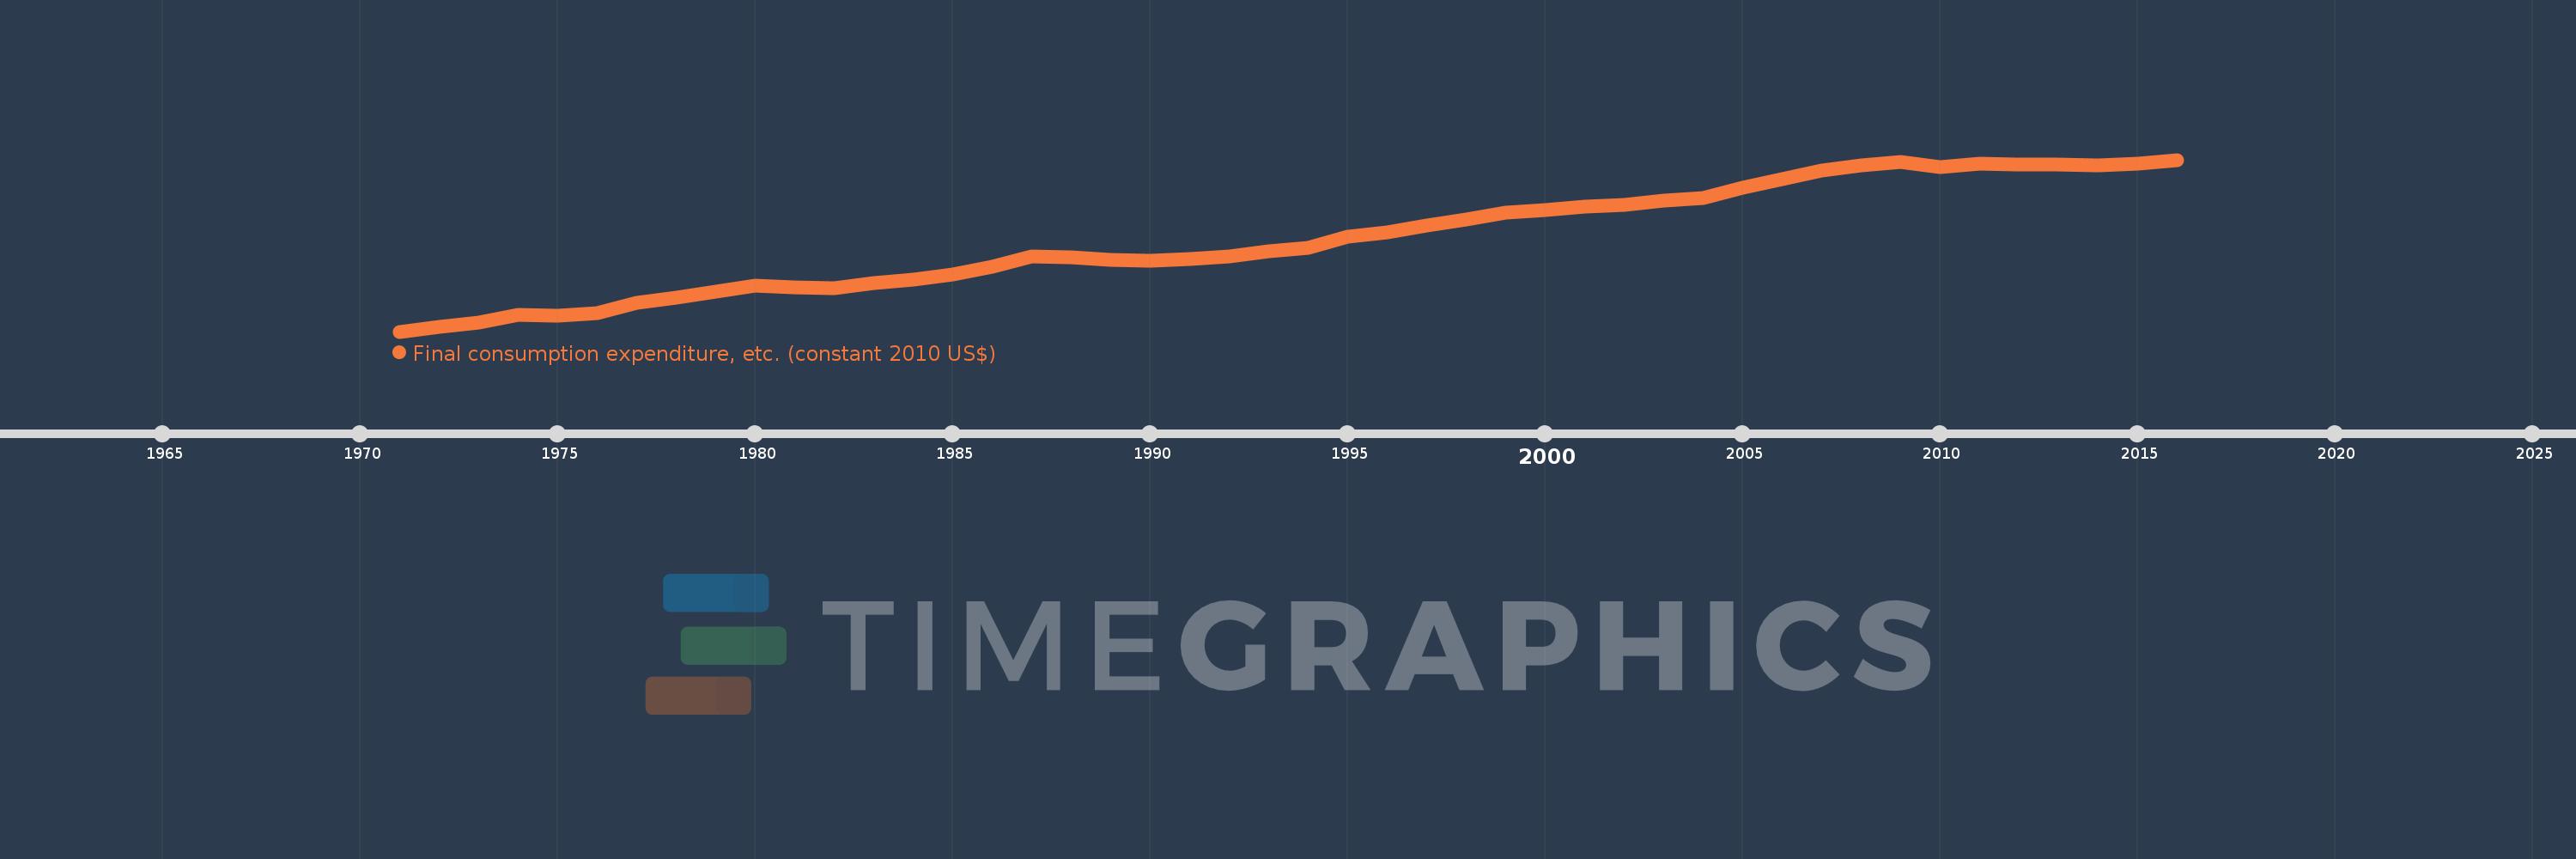
Final consumption expenditure, etc. (constant 2010 US$)
2016,2015,2014,2013,2012,2011,2010,2009,2008,2007,2006,2005,2004,2003,2002,2001,2000,1999,1998,1997,1996,1995,1994,1993,1992,1991,1990,1989,1988,1987,1986,1985,1984,1983,1982,1981,1980,1979,1978,1977,1976,1975,1974,1973,1972,1971
This statistics in other country:
AfghanistanAlbaniaAlgeriaAngolaAntigua and BarbudaArab WorldArgentinaArmeniaArubaAustraliaAustriaAzerbaijanBahamas, TheBahrainBangladeshBarbadosBelarusBelgiumBelizeBeninBermudaBhutanBoliviaBosnia and HerzegovinaBotswanaBrazilBrunei DarussalamBulgariaBurkina FasoBurundiCabo VerdeCambodiaCameroonCanadaCaribbean small statesCentral African RepublicCentral Europe and the BalticsChadChileChinaColombiaComorosCongo, Dem. Rep.Congo, Rep.Cote d'IvoireCroatiaCubaCyprusCzech RepublicDenmarkDominicaDominican RepublicEarly-demographic dividendEast Asia & PacificEast Asia & Pacific (excluding high income)East Asia & Pacific (IDA & IBRD countries)EcuadorEgypt, Arab Rep.El SalvadorEquatorial GuineaEritreaEstoniaEuro areaEurope & Central AsiaEurope & Central Asia (excluding high income)Europe & Central Asia (IDA & IBRD countries)European UnionFaroe IslandsFinlandFragile and conflict affected situationsFranceGabonGambia, TheGeorgiaGermanyGhanaGreeceGrenadaGuatemalaGuineaGuinea-BissauGuyanaHaitiHeavily indebted poor countries (HIPC)High incomeHondurasHong Kong SAR, ChinaHungaryIBRD onlyIcelandIDA & IBRD totalIDA blendIDA onlyIDA totalIndiaIndonesiaIran, Islamic Rep.IraqIrelandIsraelItalyJamaicaJapanJordanKazakhstanKenyaKorea, Rep.KosovoKuwaitKyrgyz RepublicLao PDRLate-demographic dividendLatin America & Caribbean Latin America & Caribbean (excluding high income)Latin America & the Caribbean (IDA & IBRD countries)LatviaLeast developed countries: UN classificationLebanonLiberiaLithuaniaLow & middle incomeLow incomeLower middle incomeLuxembourgMacao SAR, ChinaMacedonia, FYRMadagascarMalawiMalaysiaMaliMaltaMauritaniaMauritiusMexicoMiddle East & North AfricaMiddle East & North Africa (excluding high income)Middle East & North Africa (IDA & IBRD countries)Middle incomeMoldovaMongoliaMontenegroMoroccoMozambiqueNamibiaNepalNetherlandsNew ZealandNicaraguaNigerNigeriaNorth AmericaNorwayOECD membersOmanOther small statesPakistanPanamaParaguayPeruPhilippinesPolandPortugalPost-demographic dividendPre-demographic dividendPuerto RicoQatarRomaniaRussian FederationRwandaSaudi ArabiaSenegalSerbiaSeychellesSierra LeoneSingaporeSlovak RepublicSloveniaSmall statesSouth AfricaSouth AsiaSouth Asia (IDA & IBRD)South SudanSpainSri LankaSt. Kitts and NevisSt. LuciaSt. Vincent and the GrenadinesSub-Saharan Africa Sub-Saharan Africa (excluding high income)Sub-Saharan Africa (IDA & IBRD countries)SudanSurinameSwazilandSwedenSwitzerlandTajikistanTanzaniaThailandTimor-LesteTogoTongaTrinidad and TobagoTunisiaTurkeyTurkmenistanUgandaUkraineUnited Arab EmiratesUnited KingdomUnited StatesUpper middle incomeUruguayUzbekistanVanuatuVenezuela, RBVietnamWest Bank and GazaWorldYemen, Rep.ZambiaZimbabwe Timeline:
This timeline shows a graph from 1971 to 2016 of Denmark. No data until 1970. Number of actual observations by date: 46.
Source name:
World Development Indicators
Source organization:
World Bank national accounts data, and OECD National Accounts data files.
Categories, topics:
Economy & Growth
Last updated:
apr 23, 2017
Indicators value changes by year
Minimum:
120.256 bln
jan 1, 1971
Maximum:
244.146 bln
jan 1, 2016
At the date of observation
Value
Absolute change
Change from previous value
jan 1, 1971
120.256 bln
+120.256 bln
0.0%
jan 1, 1972
123.536 bln
+3.28 bln
2.73%
jan 1, 1973
126.661 bln
+3.125 bln
2.53%
jan 1, 1974
132.491 bln
+5.83 bln
4.6%
jan 1, 1975
131.711 bln
-779.964 mln
-0.59%
jan 1, 1976
133.841 bln
+2.13 bln
1.62%
jan 1, 1977
141.309 bln
+7.467 bln
5.58%
jan 1, 1978
144.501 bln
+3.192 bln
2.26%
jan 1, 1979
148.899 bln
+4.398 bln
3.04%
jan 1, 1980
153.549 bln
+4.651 bln
3.12%
jan 1, 1981
152.354 bln
-1.195 bln
-0.78%
jan 1, 1982
151.421 bln
-933.091 mln
-0.61%
jan 1, 1983
155.103 bln
+3.682 bln
2.43%
jan 1, 1984
157.907 bln
+2.804 bln
1.81%
jan 1, 1985
161.494 bln
+3.587 bln
2.27%
jan 1, 1986
166.838 bln
+5.343 bln
3.31%
jan 1, 1987
174.546 bln
+7.708 bln
4.62%
jan 1, 1988
174.076 bln
-469.69 mln
-0.27%
jan 1, 1989
172.187 bln
-1.889 bln
-1.09%
jan 1, 1990
171.475 bln
-712.516 mln
-0.41%
jan 1, 1991
172.344 bln
+868.991 mln
0.51%
jan 1, 1992
174.725 bln
+2.381 bln
1.38%
jan 1, 1993
178.443 bln
+3.718 bln
2.13%
jan 1, 1994
180.348 bln
+1.905 bln
1.07%
jan 1, 1995
188.659 bln
+8.311 bln
4.61%
jan 1, 1996
191.842 bln
+3.183 bln
1.69%
jan 1, 1997
196.915 bln
+5.073 bln
2.64%
jan 1, 1998
201.098 bln
+4.183 bln
2.12%
jan 1, 1999
205.927 bln
+4.829 bln
2.4%
jan 1, 2000
207.985 bln
+2.058 bln
1.0%
jan 1, 2001
210.138 bln
+2.153 bln
1.04%
jan 1, 2002
211.688 bln
+1.551 bln
0.74%
jan 1, 2003
214.624 bln
+2.936 bln
1.39%
jan 1, 2004
216.697 bln
+2.073 bln
0.97%
jan 1, 2005
224.3 bln
+7.603 bln
3.51%
jan 1, 2006
230.243 bln
+5.943 bln
2.65%
jan 1, 2007
236.459 bln
+6.217 bln
2.7%
jan 1, 2008
239.865 bln
+3.406 bln
1.44%
jan 1, 2009
242.614 bln
+2.748 bln
1.15%
jan 1, 2010
239.145 bln
-3.468 bln
-1.43%
jan 1, 2011
241.356 bln
+2.211 bln
0.92%
jan 1, 2012
240.473 bln
-883.164 mln
-0.37%
jan 1, 2013
240.996 bln
+522.928 mln
0.22%
jan 1, 2014
240.187 bln
-808.663 mln
-0.34%
jan 1, 2015
241.148 bln
+960.331 mln
0.4%
jan 1, 2016
244.146 bln
+2.999 bln
1.24%
Ranking of countries by current statistics by years


Comments: