29
/
en
AIzaSyAYiBZKx7MnpbEhh9jyipgxe19OcubqV5w
April 1, 2024
282251
Vietnam
VNM
true
2
1
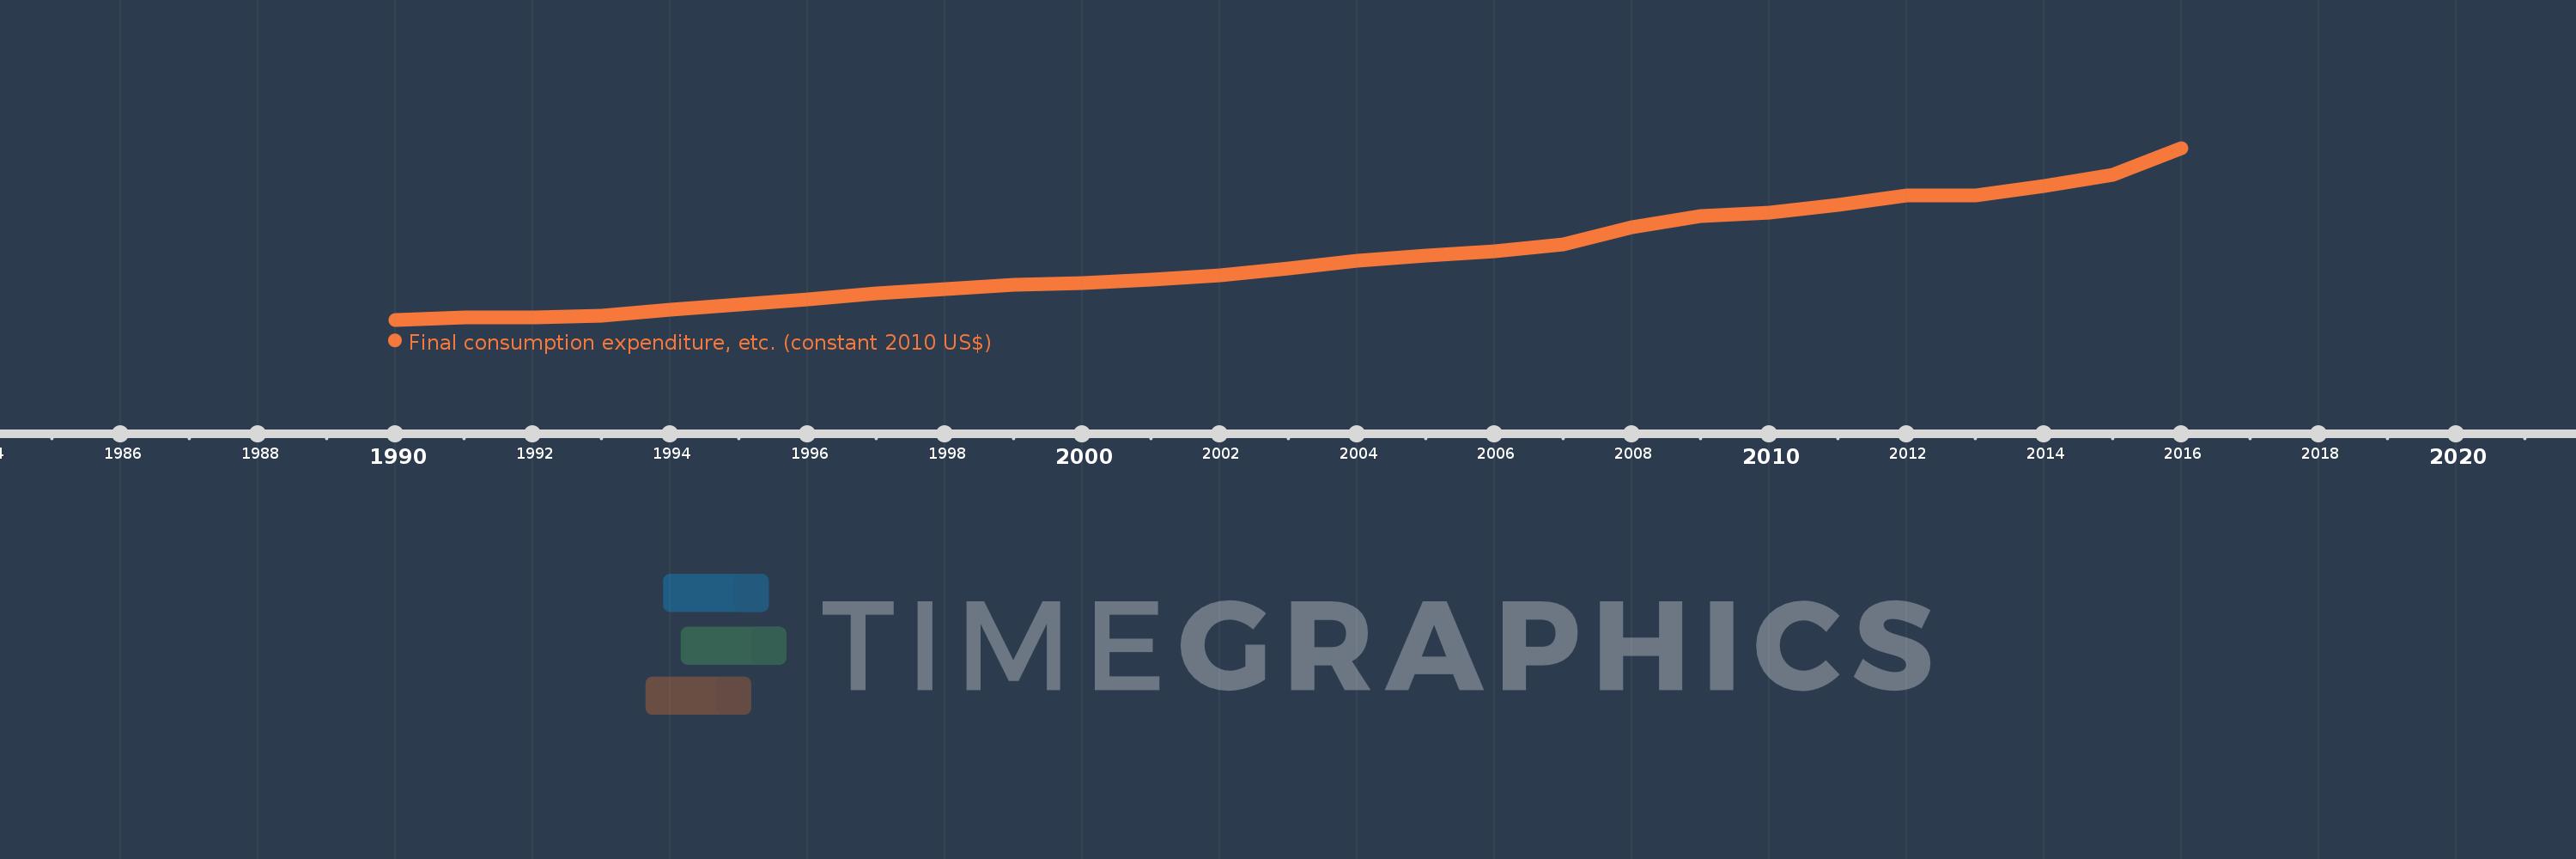
Final consumption expenditure, etc. (constant 2010 US$)
2016,2015,2014,2013,2012,2011,2010,2009,2008,2007,2006,2005,2004,2003,2002,2001,2000,1999,1998,1997,1996,1995,1994,1993,1992,1991,1990
This statistics in other country:
AfghanistanAlbaniaAlgeriaAngolaAntigua and BarbudaArab WorldArgentinaArmeniaArubaAustraliaAustriaAzerbaijanBahamas, TheBahrainBangladeshBarbadosBelarusBelgiumBelizeBeninBermudaBhutanBoliviaBosnia and HerzegovinaBotswanaBrazilBrunei DarussalamBulgariaBurkina FasoBurundiCabo VerdeCambodiaCameroonCanadaCaribbean small statesCentral African RepublicCentral Europe and the BalticsChadChileChinaColombiaComorosCongo, Dem. Rep.Congo, Rep.Cote d'IvoireCroatiaCubaCyprusCzech RepublicDenmarkDominicaDominican RepublicEarly-demographic dividendEast Asia & PacificEast Asia & Pacific (excluding high income)East Asia & Pacific (IDA & IBRD countries)EcuadorEgypt, Arab Rep.El SalvadorEquatorial GuineaEritreaEstoniaEuro areaEurope & Central AsiaEurope & Central Asia (excluding high income)Europe & Central Asia (IDA & IBRD countries)European UnionFaroe IslandsFinlandFragile and conflict affected situationsFranceGabonGambia, TheGeorgiaGermanyGhanaGreeceGrenadaGuatemalaGuineaGuinea-BissauGuyanaHaitiHeavily indebted poor countries (HIPC)High incomeHondurasHong Kong SAR, ChinaHungaryIBRD onlyIcelandIDA & IBRD totalIDA blendIDA onlyIDA totalIndiaIndonesiaIran, Islamic Rep.IraqIrelandIsraelItalyJamaicaJapanJordanKazakhstanKenyaKorea, Rep.KosovoKuwaitKyrgyz RepublicLao PDRLate-demographic dividendLatin America & Caribbean Latin America & Caribbean (excluding high income)Latin America & the Caribbean (IDA & IBRD countries)LatviaLeast developed countries: UN classificationLebanonLiberiaLithuaniaLow & middle incomeLow incomeLower middle incomeLuxembourgMacao SAR, ChinaMacedonia, FYRMadagascarMalawiMalaysiaMaliMaltaMauritaniaMauritiusMexicoMiddle East & North AfricaMiddle East & North Africa (excluding high income)Middle East & North Africa (IDA & IBRD countries)Middle incomeMoldovaMongoliaMontenegroMoroccoMozambiqueNamibiaNepalNetherlandsNew ZealandNicaraguaNigerNigeriaNorth AmericaNorwayOECD membersOmanOther small statesPakistanPanamaParaguayPeruPhilippinesPolandPortugalPost-demographic dividendPre-demographic dividendPuerto RicoQatarRomaniaRussian FederationRwandaSaudi ArabiaSenegalSerbiaSeychellesSierra LeoneSingaporeSlovak RepublicSloveniaSmall statesSouth AfricaSouth AsiaSouth Asia (IDA & IBRD)South SudanSpainSri LankaSt. Kitts and NevisSt. LuciaSt. Vincent and the GrenadinesSub-Saharan Africa Sub-Saharan Africa (excluding high income)Sub-Saharan Africa (IDA & IBRD countries)SudanSurinameSwazilandSwedenSwitzerlandTajikistanTanzaniaThailandTimor-LesteTogoTongaTrinidad and TobagoTunisiaTurkeyTurkmenistanUgandaUkraineUnited Arab EmiratesUnited KingdomUnited StatesUpper middle incomeUruguayUzbekistanVanuatuVenezuela, RBVietnamWest Bank and GazaWorldYemen, Rep.ZambiaZimbabwe Timeline:
This timeline shows a graph from 1990 to 2016 of Vietnam. No data until 1989. Number of actual observations by date: 27.
Source name:
World Development Indicators
Source organization:
World Bank national accounts data, and OECD National Accounts data files.
Categories, topics:
Economy & Growth
Last updated:
apr 23, 2017
Indicators value changes by year
Minimum:
26.95 bln
jan 1, 1990
Maximum:
112.381 bln
jan 1, 2016
At the date of observation
Value
Absolute change
Change from previous value
jan 1, 1990
26.95 bln
+26.95 bln
0.0%
jan 1, 1991
27.903 bln
+953.836 mln
3.54%
jan 1, 1992
27.925 bln
+21.703 mln
0.08%
jan 1, 1993
29.005 bln
+1.079 bln
3.87%
jan 1, 1994
32.016 bln
+3.011 bln
10.38%
jan 1, 1995
34.393 bln
+2.377 bln
7.43%
jan 1, 1996
36.94 bln
+2.547 bln
7.41%
jan 1, 1997
39.946 bln
+3.006 bln
8.14%
jan 1, 1998
42.346 bln
+2.4 bln
6.01%
jan 1, 1999
44.163 bln
+1.816 bln
4.29%
jan 1, 2000
45.129 bln
+965.93 mln
2.19%
jan 1, 2001
46.9 bln
+1.771 bln
3.92%
jan 1, 2002
48.949 bln
+2.049 bln
4.37%
jan 1, 2003
52.578 bln
+3.629 bln
7.41%
jan 1, 2004
56.376 bln
+3.798 bln
7.22%
jan 1, 2005
58.909 bln
+2.533 bln
4.49%
jan 1, 2006
60.906 bln
+1.997 bln
3.39%
jan 1, 2007
64.417 bln
+3.512 bln
5.77%
jan 1, 2008
72.87 bln
+8.453 bln
13.12%
jan 1, 2009
78.551 bln
+5.681 bln
7.8%
jan 1, 2010
80.414 bln
+1.863 bln
2.37%
jan 1, 2011
84.072 bln
+3.659 bln
4.55%
jan 1, 2012
88.944 bln
+4.871 bln
5.79%
jan 1, 2013
88.769 bln
-175.129 mln
-0.2%
jan 1, 2014
93.372 bln
+4.604 bln
5.19%
jan 1, 2015
99.195 bln
+5.823 bln
6.24%
jan 1, 2016
112.381 bln
+13.186 bln
13.29%
Ranking of countries by current statistics by years


Comments: