29
/
en
AIzaSyAYiBZKx7MnpbEhh9jyipgxe19OcubqV5w
April 1, 2024
157251
Iran, Islamic Rep.
IRN
true
2
1
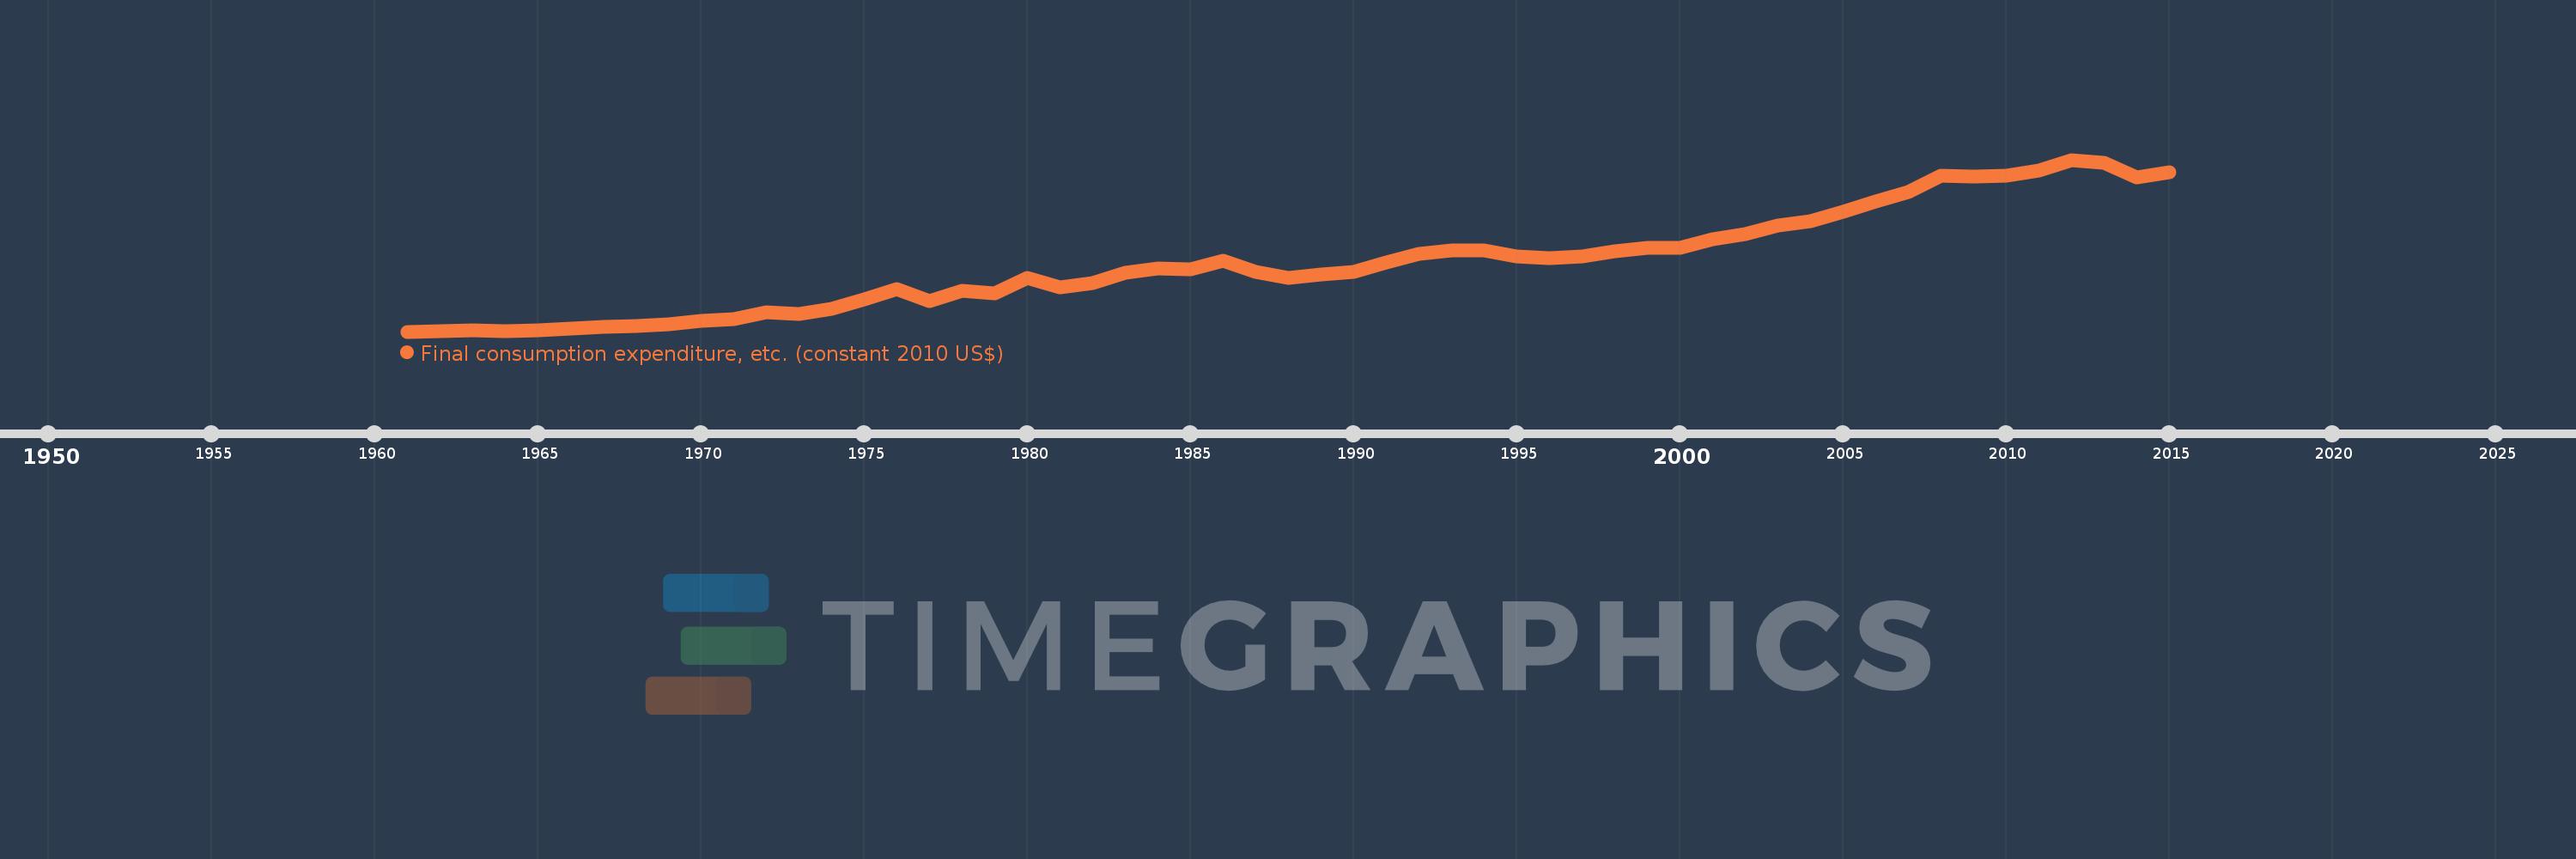
Final consumption expenditure, etc. (constant 2010 US$)
2015,2014,2013,2012,2011,2010,2009,2008,2007,2006,2005,2004,2003,2002,2001,2000,1999,1998,1997,1996,1995,1994,1993,1992,1991,1990,1989,1988,1987,1986,1985,1984,1983,1982,1981,1980,1979,1978,1977,1976,1975,1974,1973,1972,1971,1970,1969,1968,1967,1966,1965,1964,1963,1962,1961
This statistics in other country:
AfghanistanAlbaniaAlgeriaAngolaAntigua and BarbudaArab WorldArgentinaArmeniaArubaAustraliaAustriaAzerbaijanBahamas, TheBahrainBangladeshBarbadosBelarusBelgiumBelizeBeninBermudaBhutanBoliviaBosnia and HerzegovinaBotswanaBrazilBrunei DarussalamBulgariaBurkina FasoBurundiCabo VerdeCambodiaCameroonCanadaCaribbean small statesCentral African RepublicCentral Europe and the BalticsChadChileChinaColombiaComorosCongo, Dem. Rep.Congo, Rep.Cote d'IvoireCroatiaCubaCyprusCzech RepublicDenmarkDominicaDominican RepublicEarly-demographic dividendEast Asia & PacificEast Asia & Pacific (excluding high income)East Asia & Pacific (IDA & IBRD countries)EcuadorEgypt, Arab Rep.El SalvadorEquatorial GuineaEritreaEstoniaEuro areaEurope & Central AsiaEurope & Central Asia (excluding high income)Europe & Central Asia (IDA & IBRD countries)European UnionFaroe IslandsFinlandFragile and conflict affected situationsFranceGabonGambia, TheGeorgiaGermanyGhanaGreeceGrenadaGuatemalaGuineaGuinea-BissauGuyanaHaitiHeavily indebted poor countries (HIPC)High incomeHondurasHong Kong SAR, ChinaHungaryIBRD onlyIcelandIDA & IBRD totalIDA blendIDA onlyIDA totalIndiaIndonesiaIran, Islamic Rep.IraqIrelandIsraelItalyJamaicaJapanJordanKazakhstanKenyaKorea, Rep.KosovoKuwaitKyrgyz RepublicLao PDRLate-demographic dividendLatin America & Caribbean Latin America & Caribbean (excluding high income)Latin America & the Caribbean (IDA & IBRD countries)LatviaLeast developed countries: UN classificationLebanonLiberiaLithuaniaLow & middle incomeLow incomeLower middle incomeLuxembourgMacao SAR, ChinaMacedonia, FYRMadagascarMalawiMalaysiaMaliMaltaMauritaniaMauritiusMexicoMiddle East & North AfricaMiddle East & North Africa (excluding high income)Middle East & North Africa (IDA & IBRD countries)Middle incomeMoldovaMongoliaMontenegroMoroccoMozambiqueNamibiaNepalNetherlandsNew ZealandNicaraguaNigerNigeriaNorth AmericaNorwayOECD membersOmanOther small statesPakistanPanamaParaguayPeruPhilippinesPolandPortugalPost-demographic dividendPre-demographic dividendPuerto RicoQatarRomaniaRussian FederationRwandaSaudi ArabiaSenegalSerbiaSeychellesSierra LeoneSingaporeSlovak RepublicSloveniaSmall statesSouth AfricaSouth AsiaSouth Asia (IDA & IBRD)South SudanSpainSri LankaSt. Kitts and NevisSt. LuciaSt. Vincent and the GrenadinesSub-Saharan Africa Sub-Saharan Africa (excluding high income)Sub-Saharan Africa (IDA & IBRD countries)SudanSurinameSwazilandSwedenSwitzerlandTajikistanTanzaniaThailandTimor-LesteTogoTongaTrinidad and TobagoTunisiaTurkeyTurkmenistanUgandaUkraineUnited Arab EmiratesUnited KingdomUnited StatesUpper middle incomeUruguayUzbekistanVanuatuVenezuela, RBVietnamWest Bank and GazaWorldYemen, Rep.ZambiaZimbabwe Timeline:
This timeline shows a graph from 1961 to 2015 of Iran, Islamic Rep.. No data until 1960. Number of actual observations by date: 55.
Source name:
World Development Indicators
Source organization:
World Bank national accounts data, and OECD National Accounts data files.
Categories, topics:
Economy & Growth
Last updated:
apr 23, 2017
Indicators value changes by year
Minimum:
21.896 bln
jan 1, 1961
Maximum:
287.493 bln
jan 1, 2012
At the date of observation
Value
Absolute change
Change from previous value
jan 1, 1961
21.896 bln
+21.896 bln
0.0%
jan 1, 1962
22.903 bln
+1.007 bln
4.6%
jan 1, 1963
23.256 bln
+353.36 mln
1.54%
jan 1, 1964
22.845 bln
-410.83 mln
-1.77%
jan 1, 1965
23.878 bln
+1.033 bln
4.52%
jan 1, 1966
26.384 bln
+2.506 bln
10.49%
jan 1, 1967
29.277 bln
+2.894 bln
10.97%
jan 1, 1968
30.922 bln
+1.644 bln
5.62%
jan 1, 1969
33.106 bln
+2.184 bln
7.06%
jan 1, 1970
38.601 bln
+5.495 bln
16.6%
jan 1, 1971
41.299 bln
+2.698 bln
6.99%
jan 1, 1972
51.994 bln
+10.695 bln
25.9%
jan 1, 1973
49.396 bln
-2.599 bln
-5.0%
jan 1, 1974
57.548 bln
+8.153 bln
16.5%
jan 1, 1975
72.016 bln
+14.467 bln
25.14%
jan 1, 1976
88.093 bln
+16.077 bln
22.32%
jan 1, 1977
68.822 bln
-19.271 bln
-21.88%
jan 1, 1978
84.92 bln
+16.097 bln
23.39%
jan 1, 1979
80.389 bln
-4.531 bln
-5.34%
jan 1, 1980
104.303 bln
+23.914 bln
29.75%
jan 1, 1981
90.703 bln
-13.6 bln
-13.04%
jan 1, 1982
97.235 bln
+6.532 bln
7.2%
jan 1, 1983
113.351 bln
+16.116 bln
16.57%
jan 1, 1984
118.928 bln
+5.576 bln
4.92%
jan 1, 1985
118.13 bln
-797.705 mln
-0.67%
jan 1, 1986
131.846 bln
+13.716 bln
11.61%
jan 1, 1987
113.941 bln
-17.905 bln
-13.58%
jan 1, 1988
104.863 bln
-9.078 bln
-7.97%
jan 1, 1989
110.564 bln
+5.701 bln
5.44%
jan 1, 1990
114.014 bln
+3.45 bln
3.12%
jan 1, 1991
128.535 bln
+14.521 bln
12.74%
jan 1, 1992
141.966 bln
+13.431 bln
10.45%
jan 1, 1993
147.846 bln
+5.88 bln
4.14%
jan 1, 1994
147.965 bln
+119.626 mln
0.08%
jan 1, 1995
137.751 bln
-10.214 bln
-6.9%
jan 1, 1996
135.679 bln
-2.073 bln
-1.5%
jan 1, 1997
138.668 bln
+2.99 bln
2.2%
jan 1, 1998
146.01 bln
+7.341 bln
5.29%
jan 1, 1999
150.734 bln
+4.725 bln
3.24%
jan 1, 2000
151.853 bln
+1.119 bln
0.74%
jan 1, 2001
164.964 bln
+13.111 bln
8.63%
jan 1, 2002
172.92 bln
+7.957 bln
4.82%
jan 1, 2003
185.881 bln
+12.96 bln
7.49%
jan 1, 2004
192.892 bln
+7.011 bln
3.77%
jan 1, 2005
207.49 bln
+14.598 bln
7.57%
jan 1, 2006
223.064 bln
+15.574 bln
7.51%
jan 1, 2007
238.26 bln
+15.196 bln
6.81%
jan 1, 2008
263.04 bln
+24.78 bln
10.4%
jan 1, 2009
260.996 bln
-2.044 bln
-0.78%
jan 1, 2010
262.423 bln
+1.427 bln
0.55%
jan 1, 2011
270.41 bln
+7.987 bln
3.04%
jan 1, 2012
287.493 bln
+17.083 bln
6.32%
jan 1, 2013
282.689 bln
-4.804 bln
-1.67%
jan 1, 2014
260.898 bln
-21.79 bln
-7.71%
jan 1, 2015
268.85 bln
+7.952 bln
3.05%
Ranking of countries by current statistics by years


Comments: