29
/
en
AIzaSyAYiBZKx7MnpbEhh9jyipgxe19OcubqV5w
April 1, 2024
99880
Cameroon
CMR
true
2
1
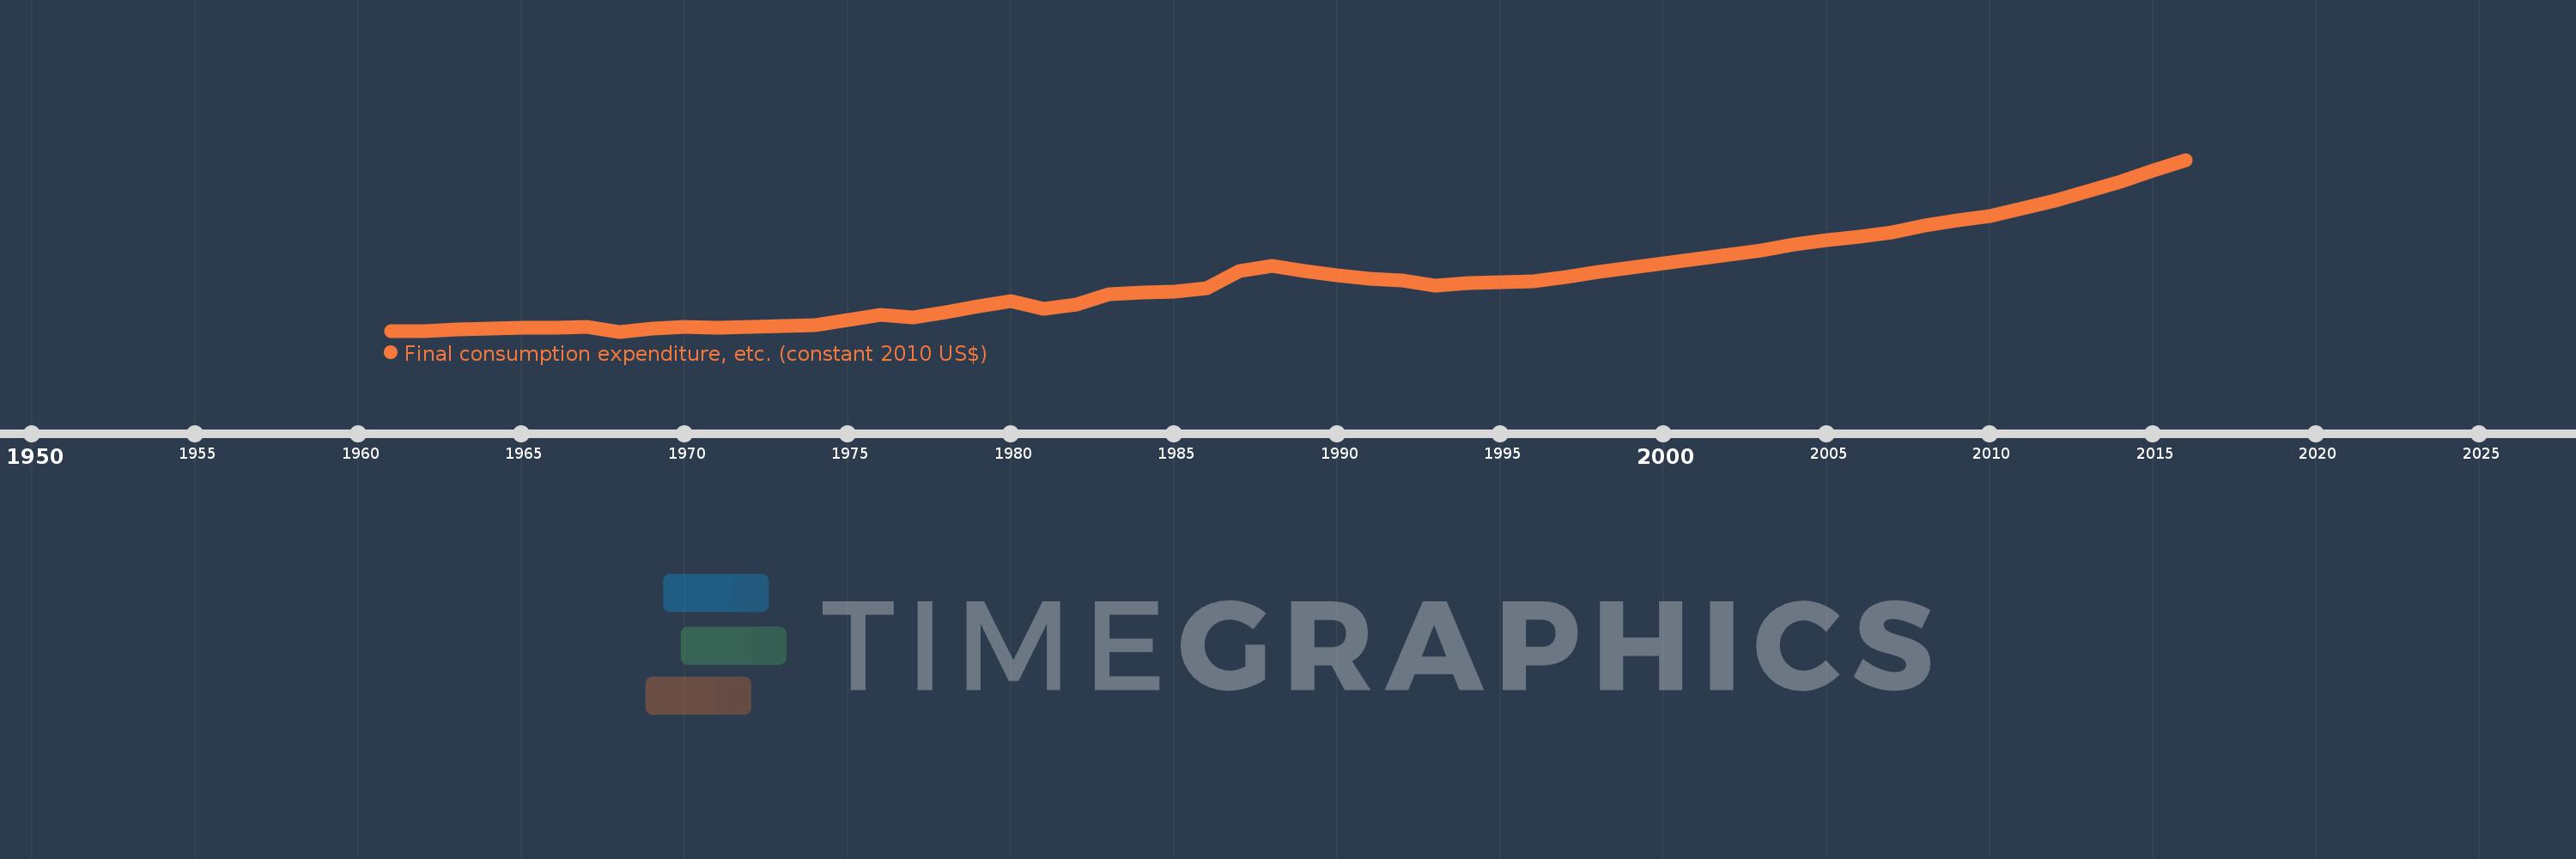
Final consumption expenditure, etc. (constant 2010 US$)
2016,2015,2014,2013,2012,2011,2010,2009,2008,2007,2006,2005,2004,2003,2002,2001,2000,1999,1998,1997,1996,1995,1994,1993,1992,1991,1990,1989,1988,1987,1986,1985,1984,1983,1982,1981,1980,1979,1978,1977,1976,1975,1974,1973,1972,1971,1970,1969,1968,1967,1966,1965,1964,1963,1962,1961
This statistics in other country:
AfghanistanAlbaniaAlgeriaAngolaAntigua and BarbudaArab WorldArgentinaArmeniaArubaAustraliaAustriaAzerbaijanBahamas, TheBahrainBangladeshBarbadosBelarusBelgiumBelizeBeninBermudaBhutanBoliviaBosnia and HerzegovinaBotswanaBrazilBrunei DarussalamBulgariaBurkina FasoBurundiCabo VerdeCambodiaCameroonCanadaCaribbean small statesCentral African RepublicCentral Europe and the BalticsChadChileChinaColombiaComorosCongo, Dem. Rep.Congo, Rep.Cote d'IvoireCroatiaCubaCyprusCzech RepublicDenmarkDominicaDominican RepublicEarly-demographic dividendEast Asia & PacificEast Asia & Pacific (excluding high income)East Asia & Pacific (IDA & IBRD countries)EcuadorEgypt, Arab Rep.El SalvadorEquatorial GuineaEritreaEstoniaEuro areaEurope & Central AsiaEurope & Central Asia (excluding high income)Europe & Central Asia (IDA & IBRD countries)European UnionFaroe IslandsFinlandFragile and conflict affected situationsFranceGabonGambia, TheGeorgiaGermanyGhanaGreeceGrenadaGuatemalaGuineaGuinea-BissauGuyanaHaitiHeavily indebted poor countries (HIPC)High incomeHondurasHong Kong SAR, ChinaHungaryIBRD onlyIcelandIDA & IBRD totalIDA blendIDA onlyIDA totalIndiaIndonesiaIran, Islamic Rep.IraqIrelandIsraelItalyJamaicaJapanJordanKazakhstanKenyaKorea, Rep.KosovoKuwaitKyrgyz RepublicLao PDRLate-demographic dividendLatin America & Caribbean Latin America & Caribbean (excluding high income)Latin America & the Caribbean (IDA & IBRD countries)LatviaLeast developed countries: UN classificationLebanonLiberiaLithuaniaLow & middle incomeLow incomeLower middle incomeLuxembourgMacao SAR, ChinaMacedonia, FYRMadagascarMalawiMalaysiaMaliMaltaMauritaniaMauritiusMexicoMiddle East & North AfricaMiddle East & North Africa (excluding high income)Middle East & North Africa (IDA & IBRD countries)Middle incomeMoldovaMongoliaMontenegroMoroccoMozambiqueNamibiaNepalNetherlandsNew ZealandNicaraguaNigerNigeriaNorth AmericaNorwayOECD membersOmanOther small statesPakistanPanamaParaguayPeruPhilippinesPolandPortugalPost-demographic dividendPre-demographic dividendPuerto RicoQatarRomaniaRussian FederationRwandaSaudi ArabiaSenegalSerbiaSeychellesSierra LeoneSingaporeSlovak RepublicSloveniaSmall statesSouth AfricaSouth AsiaSouth Asia (IDA & IBRD)South SudanSpainSri LankaSt. Kitts and NevisSt. LuciaSt. Vincent and the GrenadinesSub-Saharan Africa Sub-Saharan Africa (excluding high income)Sub-Saharan Africa (IDA & IBRD countries)SudanSurinameSwazilandSwedenSwitzerlandTajikistanTanzaniaThailandTimor-LesteTogoTongaTrinidad and TobagoTunisiaTurkeyTurkmenistanUgandaUkraineUnited Arab EmiratesUnited KingdomUnited StatesUpper middle incomeUruguayUzbekistanVanuatuVenezuela, RBVietnamWest Bank and GazaWorldYemen, Rep.ZambiaZimbabwe Timeline:
This timeline shows a graph from 1961 to 2016 of Cameroon. No data until 1960. Number of actual observations by date: 56.
Source name:
World Development Indicators
Source organization:
World Bank national accounts data, and OECD National Accounts data files.
Categories, topics:
Economy & Growth
Last updated:
apr 23, 2017
Indicators value changes by year
Minimum:
4.18 bln
jan 1, 1968
Maximum:
26.901 bln
jan 1, 2016
At the date of observation
Value
Absolute change
Change from previous value
jan 1, 1961
4.228 bln
+4.228 bln
0.0%
jan 1, 1962
4.289 bln
+60.875 mln
1.44%
jan 1, 1963
4.426 bln
+137.279 mln
3.2%
jan 1, 1964
4.594 bln
+167.708 mln
3.79%
jan 1, 1965
4.716 bln
+122.288 mln
2.66%
jan 1, 1966
4.649 bln
-66.791 mln
-1.42%
jan 1, 1967
4.751 bln
+101.836 mln
2.19%
jan 1, 1968
4.18 bln
-571.334 mln
-12.03%
jan 1, 1969
4.565 bln
+384.968 mln
9.21%
jan 1, 1970
4.79 bln
+224.913 mln
4.93%
jan 1, 1971
4.708 bln
-81.547 mln
-1.7%
jan 1, 1972
4.856 bln
+148.387 mln
3.15%
jan 1, 1973
4.875 bln
+18.169 mln
0.37%
jan 1, 1974
4.999 bln
+123.999 mln
2.54%
jan 1, 1975
5.704 bln
+705.562 mln
14.12%
jan 1, 1976
6.424 bln
+719.897 mln
12.62%
jan 1, 1977
6.063 bln
-360.659 mln
-5.61%
jan 1, 1978
6.77 bln
+706.081 mln
11.64%
jan 1, 1979
7.492 bln
+722.057 mln
10.67%
jan 1, 1980
8.174 bln
+682.654 mln
9.11%
jan 1, 1981
7.2 bln
-974.667 mln
-11.92%
jan 1, 1982
7.767 bln
+567.128 mln
7.88%
jan 1, 1983
9.101 bln
+1.335 bln
17.18%
jan 1, 1984
9.292 bln
+191.084 mln
2.1%
jan 1, 1985
9.443 bln
+150.225 mln
1.62%
jan 1, 1986
9.959 bln
+516.51 mln
5.47%
jan 1, 1987
12.146 bln
+2.187 bln
21.96%
jan 1, 1988
12.845 bln
+698.952 mln
5.75%
jan 1, 1989
12.136 bln
-709.221 mln
-5.52%
jan 1, 1990
11.597 bln
-539.34 mln
-4.44%
jan 1, 1991
11.12 bln
-476.786 mln
-4.11%
jan 1, 1992
10.931 bln
-189.043 mln
-1.7%
jan 1, 1993
10.314 bln
-617.328 mln
-5.65%
jan 1, 1994
10.623 bln
+309.148 mln
3.0%
jan 1, 1995
10.663 bln
+40.296 mln
0.38%
jan 1, 1996
10.88 bln
+216.963 mln
2.03%
jan 1, 1997
11.418 bln
+538.066 mln
4.95%
jan 1, 1998
12.081 bln
+663.13 mln
5.81%
jan 1, 1999
12.628 bln
+547.347 mln
4.53%
jan 1, 2000
13.203 bln
+574.678 mln
4.55%
jan 1, 2001
13.764 bln
+561.043 mln
4.25%
jan 1, 2002
14.293 bln
+528.646 mln
3.84%
jan 1, 2003
14.889 bln
+596.099 mln
4.17%
jan 1, 2004
15.735 bln
+846.4 mln
5.68%
jan 1, 2005
16.251 bln
+515.248 mln
3.27%
jan 1, 2006
16.713 bln
+462.179 mln
2.84%
jan 1, 2007
17.324 bln
+611.334 mln
3.66%
jan 1, 2008
18.216 bln
+891.413 mln
5.15%
jan 1, 2009
18.865 bln
+649.783 mln
3.57%
jan 1, 2010
19.484 bln
+618.241 mln
3.28%
jan 1, 2011
20.463 bln
+979.17 mln
5.03%
jan 1, 2012
21.557 bln
+1.095 bln
5.35%
jan 1, 2013
22.731 bln
+1.174 bln
5.44%
jan 1, 2014
24.011 bln
+1.28 bln
5.63%
jan 1, 2015
25.426 bln
+1.416 bln
5.9%
jan 1, 2016
26.901 bln
+1.475 bln
5.8%
Ranking of countries by current statistics by years


Comments: