29
/
en
AIzaSyAYiBZKx7MnpbEhh9jyipgxe19OcubqV5w
April 1, 2024
110894
Congo, Rep.
COG
true
2
1
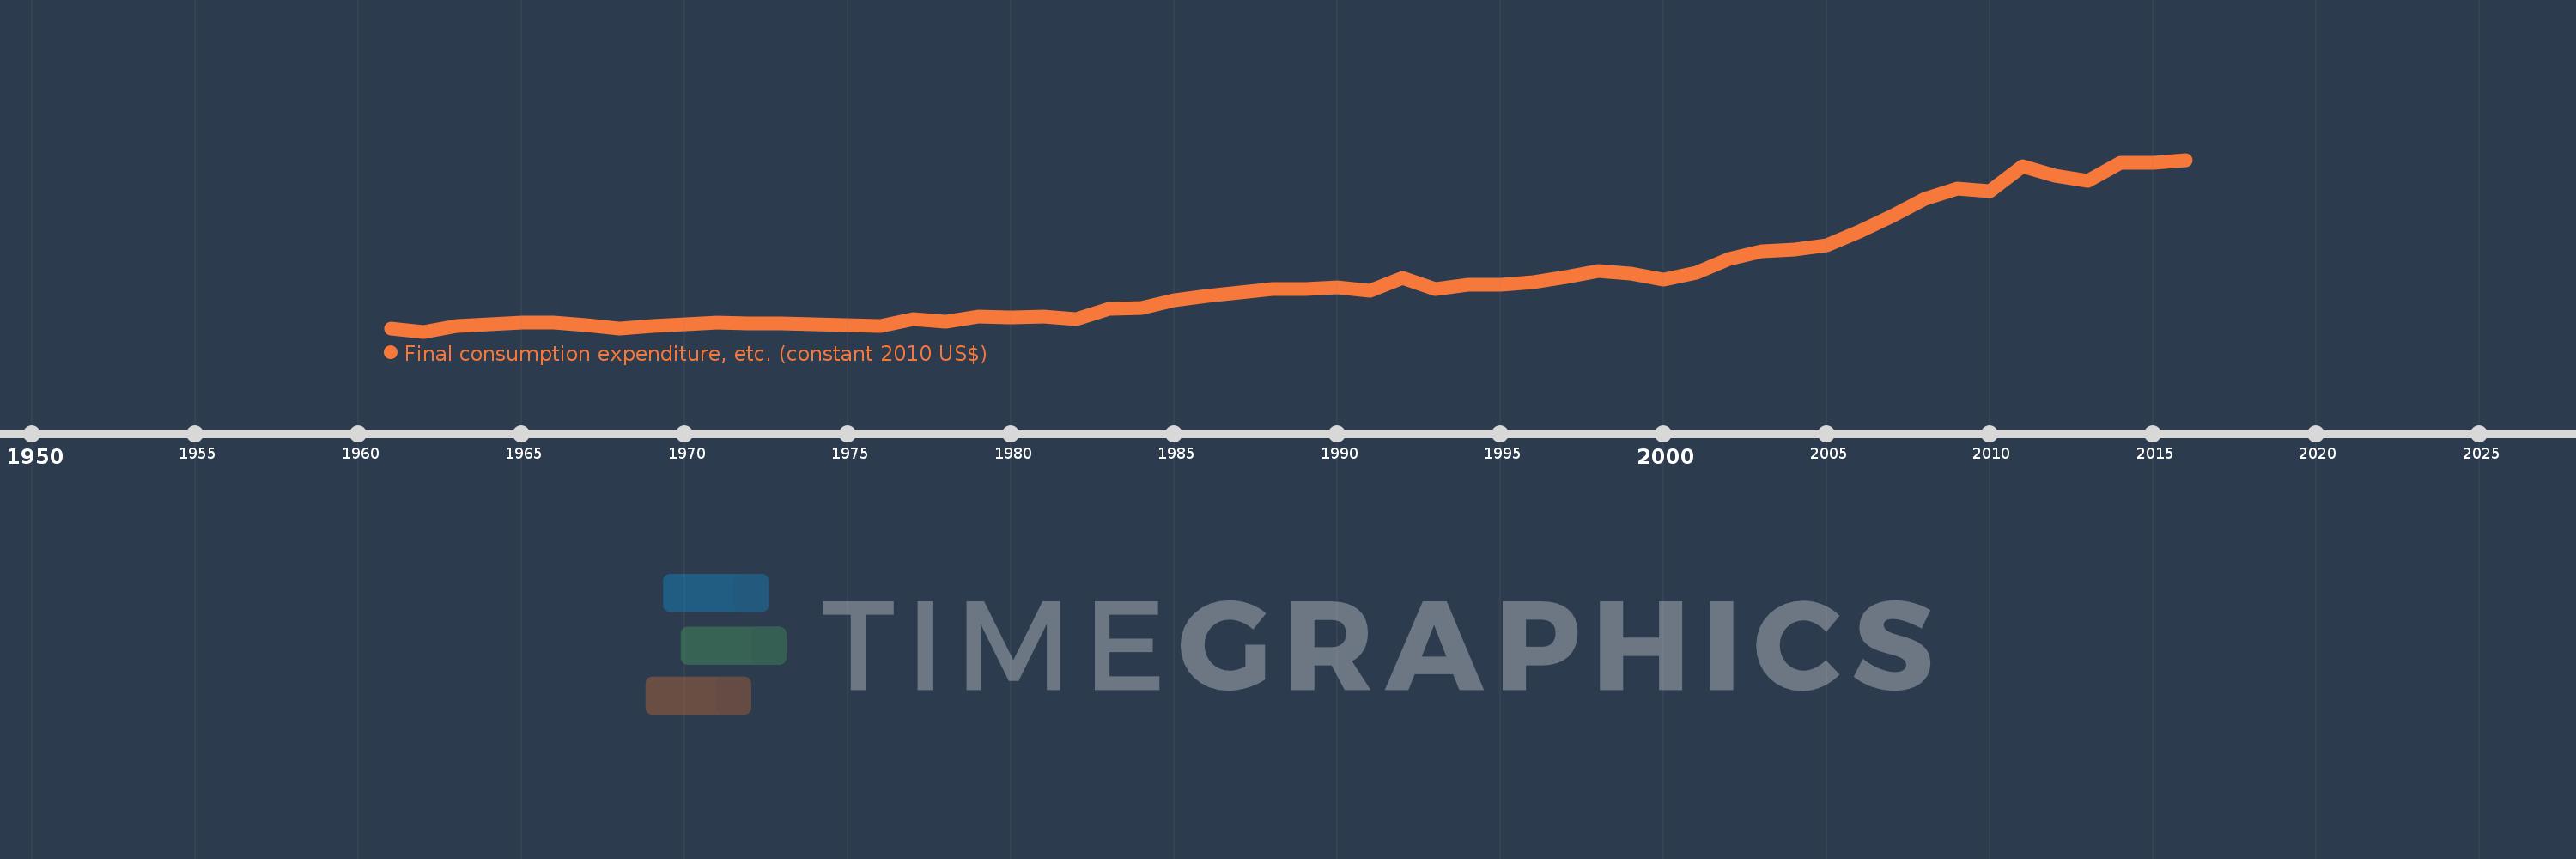
Final consumption expenditure, etc. (constant 2010 US$)
2016,2015,2014,2013,2012,2011,2010,2009,2008,2007,2006,2005,2004,2003,2002,2001,2000,1999,1998,1997,1996,1995,1994,1993,1992,1991,1990,1989,1988,1987,1986,1985,1984,1983,1982,1981,1980,1979,1978,1977,1976,1975,1974,1973,1972,1971,1970,1969,1968,1967,1966,1965,1964,1963,1962,1961
This statistics in other country:
AfghanistanAlbaniaAlgeriaAngolaAntigua and BarbudaArab WorldArgentinaArmeniaArubaAustraliaAustriaAzerbaijanBahamas, TheBahrainBangladeshBarbadosBelarusBelgiumBelizeBeninBermudaBhutanBoliviaBosnia and HerzegovinaBotswanaBrazilBrunei DarussalamBulgariaBurkina FasoBurundiCabo VerdeCambodiaCameroonCanadaCaribbean small statesCentral African RepublicCentral Europe and the BalticsChadChileChinaColombiaComorosCongo, Dem. Rep.Congo, Rep.Cote d'IvoireCroatiaCubaCyprusCzech RepublicDenmarkDominicaDominican RepublicEarly-demographic dividendEast Asia & PacificEast Asia & Pacific (excluding high income)East Asia & Pacific (IDA & IBRD countries)EcuadorEgypt, Arab Rep.El SalvadorEquatorial GuineaEritreaEstoniaEuro areaEurope & Central AsiaEurope & Central Asia (excluding high income)Europe & Central Asia (IDA & IBRD countries)European UnionFaroe IslandsFinlandFragile and conflict affected situationsFranceGabonGambia, TheGeorgiaGermanyGhanaGreeceGrenadaGuatemalaGuineaGuinea-BissauGuyanaHaitiHeavily indebted poor countries (HIPC)High incomeHondurasHong Kong SAR, ChinaHungaryIBRD onlyIcelandIDA & IBRD totalIDA blendIDA onlyIDA totalIndiaIndonesiaIran, Islamic Rep.IraqIrelandIsraelItalyJamaicaJapanJordanKazakhstanKenyaKorea, Rep.KosovoKuwaitKyrgyz RepublicLao PDRLate-demographic dividendLatin America & Caribbean Latin America & Caribbean (excluding high income)Latin America & the Caribbean (IDA & IBRD countries)LatviaLeast developed countries: UN classificationLebanonLiberiaLithuaniaLow & middle incomeLow incomeLower middle incomeLuxembourgMacao SAR, ChinaMacedonia, FYRMadagascarMalawiMalaysiaMaliMaltaMauritaniaMauritiusMexicoMiddle East & North AfricaMiddle East & North Africa (excluding high income)Middle East & North Africa (IDA & IBRD countries)Middle incomeMoldovaMongoliaMontenegroMoroccoMozambiqueNamibiaNepalNetherlandsNew ZealandNicaraguaNigerNigeriaNorth AmericaNorwayOECD membersOmanOther small statesPakistanPanamaParaguayPeruPhilippinesPolandPortugalPost-demographic dividendPre-demographic dividendPuerto RicoQatarRomaniaRussian FederationRwandaSaudi ArabiaSenegalSerbiaSeychellesSierra LeoneSingaporeSlovak RepublicSloveniaSmall statesSouth AfricaSouth AsiaSouth Asia (IDA & IBRD)South SudanSpainSri LankaSt. Kitts and NevisSt. LuciaSt. Vincent and the GrenadinesSub-Saharan Africa Sub-Saharan Africa (excluding high income)Sub-Saharan Africa (IDA & IBRD countries)SudanSurinameSwazilandSwedenSwitzerlandTajikistanTanzaniaThailandTimor-LesteTogoTongaTrinidad and TobagoTunisiaTurkeyTurkmenistanUgandaUkraineUnited Arab EmiratesUnited KingdomUnited StatesUpper middle incomeUruguayUzbekistanVanuatuVenezuela, RBVietnamWest Bank and GazaWorldYemen, Rep.ZambiaZimbabwe Timeline:
This timeline shows a graph from 1961 to 2016 of Congo, Rep.. No data until 1960. Number of actual observations by date: 56.
Source name:
World Development Indicators
Source organization:
World Bank national accounts data, and OECD National Accounts data files.
Categories, topics:
Economy & Growth
Last updated:
apr 23, 2017
Indicators value changes by year
Minimum:
432.997 mln
jan 1, 1962
Maximum:
6.093 bln
jan 1, 2016
At the date of observation
Value
Absolute change
Change from previous value
jan 1, 1961
530.829 mln
+530.829 mln
0.0%
jan 1, 1962
432.997 mln
-97.831 mln
-18.43%
jan 1, 1963
613.892 mln
+180.895 mln
41.78%
jan 1, 1964
677.54 mln
+63.648 mln
10.37%
jan 1, 1965
728.813 mln
+51.273 mln
7.57%
jan 1, 1966
724.056 mln
-4.757 mln
-0.65%
jan 1, 1967
631.401 mln
-92.655 mln
-12.8%
jan 1, 1968
525.121 mln
-106.281 mln
-16.83%
jan 1, 1969
609.748 mln
+84.628 mln
16.12%
jan 1, 1970
681.847 mln
+72.099 mln
11.82%
jan 1, 1971
721.188 mln
+39.341 mln
5.77%
jan 1, 1972
707.69 mln
-13.498 mln
-1.87%
jan 1, 1973
697.001 mln
-10.689 mln
-1.51%
jan 1, 1974
672.952 mln
-24.049 mln
-3.45%
jan 1, 1975
632.841 mln
-40.11 mln
-5.96%
jan 1, 1976
614.613 mln
-18.228 mln
-2.88%
jan 1, 1977
844.527 mln
+229.913 mln
37.41%
jan 1, 1978
749.91 mln
-94.616 mln
-11.2%
jan 1, 1979
919.141 mln
+169.231 mln
22.57%
jan 1, 1980
893.109 mln
-26.032 mln
-2.83%
jan 1, 1981
940.805 mln
+47.697 mln
5.34%
jan 1, 1982
829.208 mln
-111.597 mln
-11.86%
jan 1, 1983
1.18 bln
+350.989 mln
42.33%
jan 1, 1984
1.198 bln
+18.096 mln
1.53%
jan 1, 1985
1.463 bln
+264.832 mln
22.1%
jan 1, 1986
1.605 bln
+141.452 mln
9.67%
jan 1, 1987
1.731 bln
+126.172 mln
7.86%
jan 1, 1988
1.846 bln
+114.856 mln
6.64%
jan 1, 1989
1.831 bln
-14.722 mln
-0.8%
jan 1, 1990
1.893 bln
+62.096 mln
3.39%
jan 1, 1991
1.771 bln
-121.861 mln
-6.44%
jan 1, 1992
2.196 bln
+424.95 mln
23.99%
jan 1, 1993
1.841 bln
-355.316 mln
-16.18%
jan 1, 1994
1.971 bln
+130.068 mln
7.07%
jan 1, 1995
1.971 bln
-181.885K
-0.01%
jan 1, 1996
2.053 bln
+81.903 mln
4.16%
jan 1, 1997
2.223 bln
+170.306 mln
8.3%
jan 1, 1998
2.419 bln
+195.82 mln
8.81%
jan 1, 1999
2.336 bln
-82.597 mln
-3.41%
jan 1, 2000
2.14 bln
-196.43 mln
-8.41%
jan 1, 2001
2.382 bln
+242.406 mln
11.33%
jan 1, 2002
2.822 bln
+440.134 mln
18.48%
jan 1, 2003
3.068 bln
+245.937 mln
8.71%
jan 1, 2004
3.126 bln
+58.253 mln
1.9%
jan 1, 2005
3.275 bln
+148.334 mln
4.74%
jan 1, 2006
3.735 bln
+460.622 mln
14.07%
jan 1, 2007
4.234 bln
+498.457 mln
13.34%
jan 1, 2008
4.805 bln
+571.201 mln
13.49%
jan 1, 2009
5.146 bln
+341.371 mln
7.1%
jan 1, 2010
5.07 bln
-76.03 mln
-1.48%
jan 1, 2011
5.89 bln
+820.152 mln
16.18%
jan 1, 2012
5.581 bln
-309.899 mln
-5.26%
jan 1, 2013
5.388 bln
-192.453 mln
-3.45%
jan 1, 2014
5.983 bln
+595.202 mln
11.05%
jan 1, 2015
6.006 bln
+22.948 mln
0.38%
jan 1, 2016
6.093 bln
+86.39 mln
1.44%
Ranking of countries by current statistics by years


Comments: