29
/
en
AIzaSyAYiBZKx7MnpbEhh9jyipgxe19OcubqV5w
April 1, 2024
154558
India
IND
true
2
1
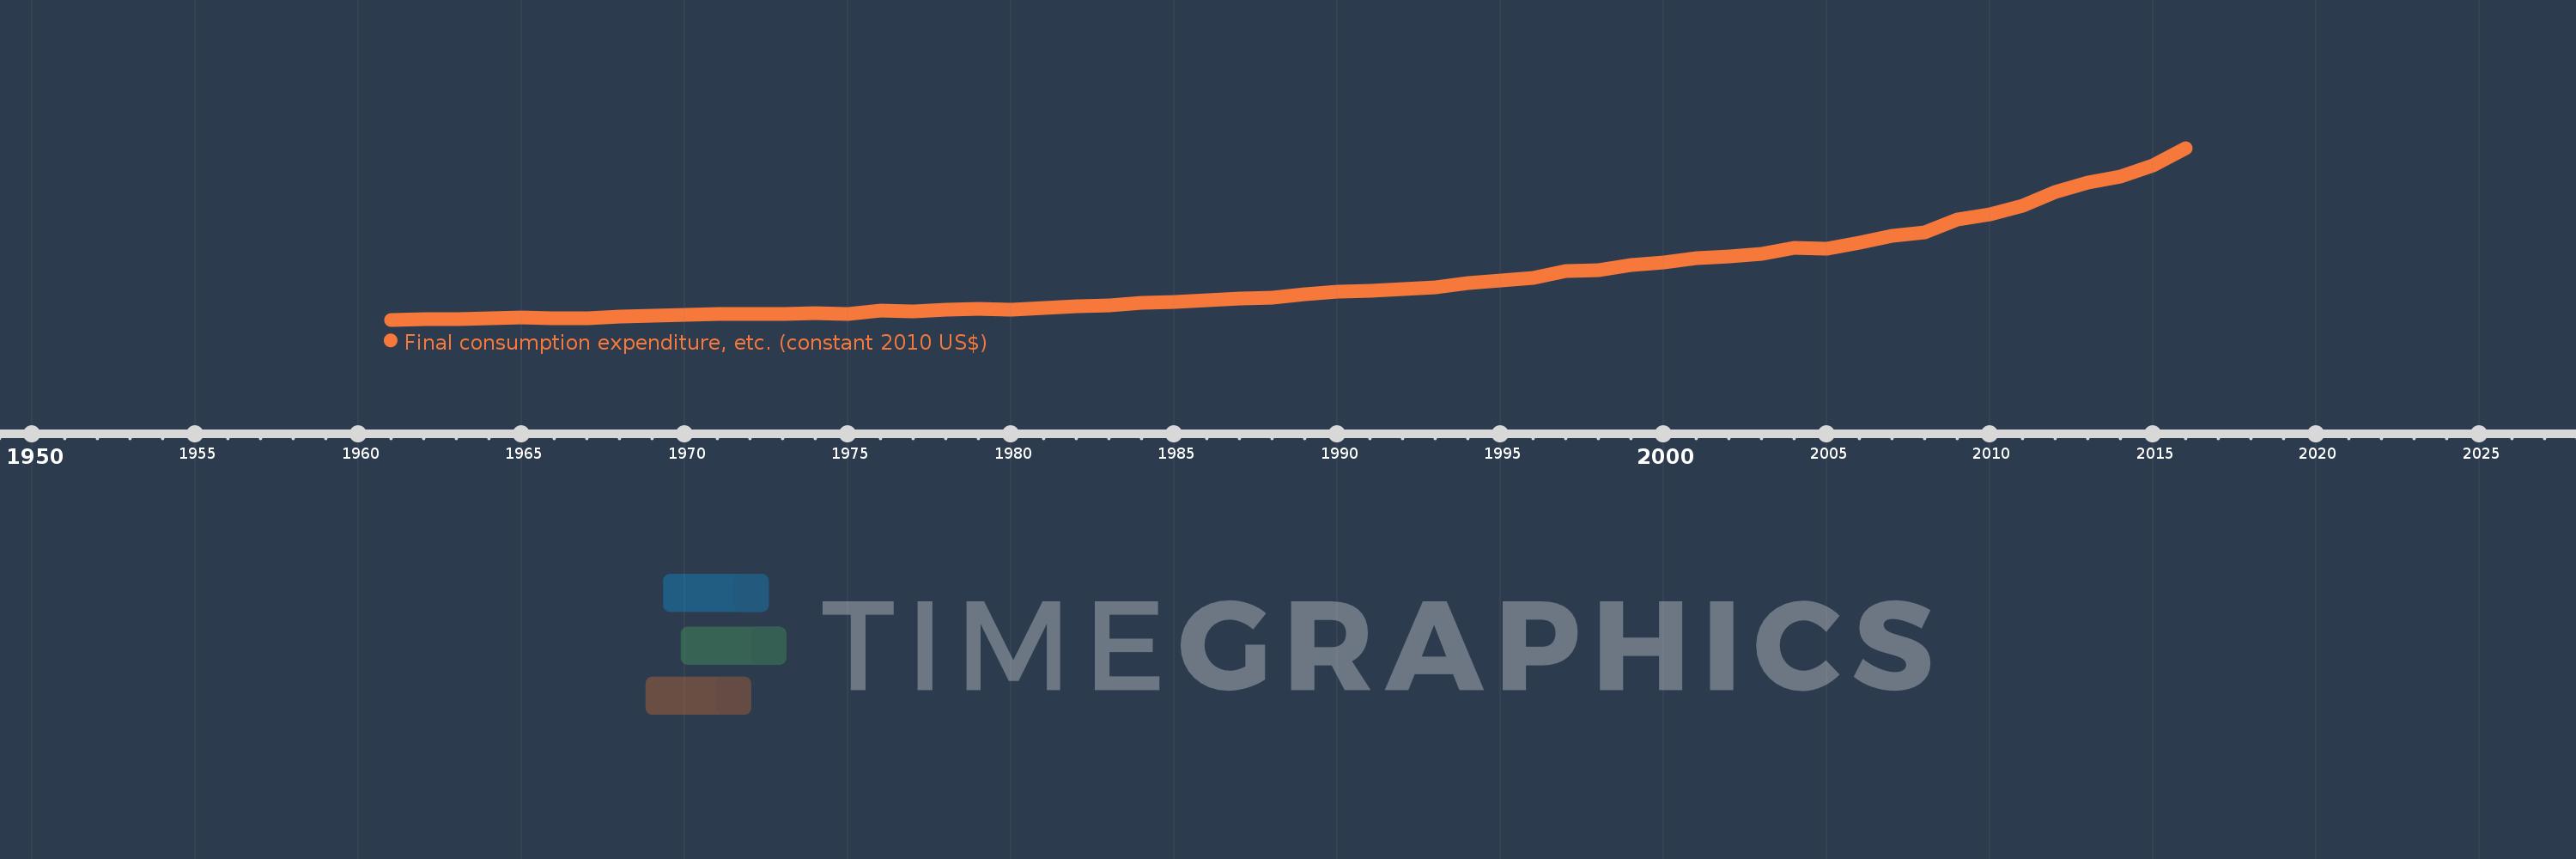
Final consumption expenditure, etc. (constant 2010 US$)
2016,2015,2014,2013,2012,2011,2010,2009,2008,2007,2006,2005,2004,2003,2002,2001,2000,1999,1998,1997,1996,1995,1994,1993,1992,1991,1990,1989,1988,1987,1986,1985,1984,1983,1982,1981,1980,1979,1978,1977,1976,1975,1974,1973,1972,1971,1970,1969,1968,1967,1966,1965,1964,1963,1962,1961
This statistics in other country:
AfghanistanAlbaniaAlgeriaAngolaAntigua and BarbudaArab WorldArgentinaArmeniaArubaAustraliaAustriaAzerbaijanBahamas, TheBahrainBangladeshBarbadosBelarusBelgiumBelizeBeninBermudaBhutanBoliviaBosnia and HerzegovinaBotswanaBrazilBrunei DarussalamBulgariaBurkina FasoBurundiCabo VerdeCambodiaCameroonCanadaCaribbean small statesCentral African RepublicCentral Europe and the BalticsChadChileChinaColombiaComorosCongo, Dem. Rep.Congo, Rep.Cote d'IvoireCroatiaCubaCyprusCzech RepublicDenmarkDominicaDominican RepublicEarly-demographic dividendEast Asia & PacificEast Asia & Pacific (excluding high income)East Asia & Pacific (IDA & IBRD countries)EcuadorEgypt, Arab Rep.El SalvadorEquatorial GuineaEritreaEstoniaEuro areaEurope & Central AsiaEurope & Central Asia (excluding high income)Europe & Central Asia (IDA & IBRD countries)European UnionFaroe IslandsFinlandFragile and conflict affected situationsFranceGabonGambia, TheGeorgiaGermanyGhanaGreeceGrenadaGuatemalaGuineaGuinea-BissauGuyanaHaitiHeavily indebted poor countries (HIPC)High incomeHondurasHong Kong SAR, ChinaHungaryIBRD onlyIcelandIDA & IBRD totalIDA blendIDA onlyIDA totalIndiaIndonesiaIran, Islamic Rep.IraqIrelandIsraelItalyJamaicaJapanJordanKazakhstanKenyaKorea, Rep.KosovoKuwaitKyrgyz RepublicLao PDRLate-demographic dividendLatin America & Caribbean Latin America & Caribbean (excluding high income)Latin America & the Caribbean (IDA & IBRD countries)LatviaLeast developed countries: UN classificationLebanonLiberiaLithuaniaLow & middle incomeLow incomeLower middle incomeLuxembourgMacao SAR, ChinaMacedonia, FYRMadagascarMalawiMalaysiaMaliMaltaMauritaniaMauritiusMexicoMiddle East & North AfricaMiddle East & North Africa (excluding high income)Middle East & North Africa (IDA & IBRD countries)Middle incomeMoldovaMongoliaMontenegroMoroccoMozambiqueNamibiaNepalNetherlandsNew ZealandNicaraguaNigerNigeriaNorth AmericaNorwayOECD membersOmanOther small statesPakistanPanamaParaguayPeruPhilippinesPolandPortugalPost-demographic dividendPre-demographic dividendPuerto RicoQatarRomaniaRussian FederationRwandaSaudi ArabiaSenegalSerbiaSeychellesSierra LeoneSingaporeSlovak RepublicSloveniaSmall statesSouth AfricaSouth AsiaSouth Asia (IDA & IBRD)South SudanSpainSri LankaSt. Kitts and NevisSt. LuciaSt. Vincent and the GrenadinesSub-Saharan Africa Sub-Saharan Africa (excluding high income)Sub-Saharan Africa (IDA & IBRD countries)SudanSurinameSwazilandSwedenSwitzerlandTajikistanTanzaniaThailandTimor-LesteTogoTongaTrinidad and TobagoTunisiaTurkeyTurkmenistanUgandaUkraineUnited Arab EmiratesUnited KingdomUnited StatesUpper middle incomeUruguayUzbekistanVanuatuVenezuela, RBVietnamWest Bank and GazaWorldYemen, Rep.ZambiaZimbabwe Timeline:
This timeline shows a graph from 1961 to 2016 of India. No data until 1960. Number of actual observations by date: 56.
Source name:
World Development Indicators
Source organization:
World Bank national accounts data, and OECD National Accounts data files.
Categories, topics:
Economy & Growth
Last updated:
apr 23, 2017
Indicators value changes by year
Minimum:
119.049 bln
jan 1, 1961
Maximum:
1.538 trl
jan 1, 2016
At the date of observation
Value
Absolute change
Change from previous value
jan 1, 1961
119.049 bln
+119.049 bln
0.0%
jan 1, 1962
121.539 bln
+2.49 bln
2.09%
jan 1, 1963
124.165 bln
+2.625 bln
2.16%
jan 1, 1964
129.753 bln
+5.589 bln
4.5%
jan 1, 1965
138.89 bln
+9.136 bln
7.04%
jan 1, 1966
133.67 bln
-5.22 bln
-3.76%
jan 1, 1967
134.052 bln
+381.834 mln
0.29%
jan 1, 1968
144.775 bln
+10.723 bln
8.0%
jan 1, 1969
148.985 bln
+4.21 bln
2.91%
jan 1, 1970
157.868 bln
+8.883 bln
5.96%
jan 1, 1971
168.005 bln
+10.137 bln
6.42%
jan 1, 1972
168.559 bln
+553.925 mln
0.33%
jan 1, 1973
167.165 bln
-1.395 bln
-0.83%
jan 1, 1974
172.273 bln
+5.109 bln
3.06%
jan 1, 1975
169.644 bln
-2.629 bln
-1.53%
jan 1, 1976
191.611 bln
+21.967 bln
12.95%
jan 1, 1977
187.484 bln
-4.127 bln
-2.15%
jan 1, 1978
201.866 bln
+14.383 bln
7.67%
jan 1, 1979
209.827 bln
+7.961 bln
3.94%
jan 1, 1980
198.675 bln
-11.152 bln
-5.32%
jan 1, 1981
217.751 bln
+19.077 bln
9.6%
jan 1, 1982
227.019 bln
+9.268 bln
4.26%
jan 1, 1983
234.81 bln
+7.791 bln
3.43%
jan 1, 1984
260.85 bln
+26.039 bln
11.09%
jan 1, 1985
262.591 bln
+1.741 bln
0.67%
jan 1, 1986
277.819 bln
+15.228 bln
5.8%
jan 1, 1987
293.008 bln
+15.189 bln
5.47%
jan 1, 1988
304.503 bln
+11.495 bln
3.92%
jan 1, 1989
330.996 bln
+26.492 bln
8.7%
jan 1, 1990
349.35 bln
+18.354 bln
5.55%
jan 1, 1991
359.333 bln
+9.983 bln
2.86%
jan 1, 1992
372.462 bln
+13.129 bln
3.65%
jan 1, 1993
388.527 bln
+16.065 bln
4.31%
jan 1, 1994
423.048 bln
+34.521 bln
8.89%
jan 1, 1995
445.352 bln
+22.304 bln
5.27%
jan 1, 1996
466.354 bln
+21.003 bln
4.72%
jan 1, 1997
519.37 bln
+53.016 bln
11.37%
jan 1, 1998
531.923 bln
+12.553 bln
2.42%
jan 1, 1999
573.95 bln
+42.028 bln
7.9%
jan 1, 2000
593.838 bln
+19.887 bln
3.46%
jan 1, 2001
627.277 bln
+33.439 bln
5.63%
jan 1, 2002
643.968 bln
+16.691 bln
2.66%
jan 1, 2003
661.917 bln
+17.95 bln
2.79%
jan 1, 2004
711.132 bln
+49.214 bln
7.44%
jan 1, 2005
703.099 bln
-8.033 bln
-1.13%
jan 1, 2006
758.398 bln
+55.299 bln
7.87%
jan 1, 2007
809.715 bln
+51.317 bln
6.77%
jan 1, 2008
838.274 bln
+28.56 bln
3.53%
jan 1, 2009
949.651 bln
+111.376 bln
13.29%
jan 1, 2010
987.013 bln
+37.362 bln
3.93%
jan 1, 2011
1.058 trl
+70.534 bln
7.15%
jan 1, 2012
1.178 trl
+120.013 bln
11.35%
jan 1, 2013
1.251 trl
+73.305 bln
6.23%
jan 1, 2014
1.299 trl
+48.135 bln
3.85%
jan 1, 2015
1.395 trl
+96.242 bln
7.41%
jan 1, 2016
1.538 trl
+143.179 bln
10.26%
Ranking of countries by current statistics by years


Comments: