29
/
en
AIzaSyAYiBZKx7MnpbEhh9jyipgxe19OcubqV5w
April 1, 2024
214277
Norway
NOR
true
2
1
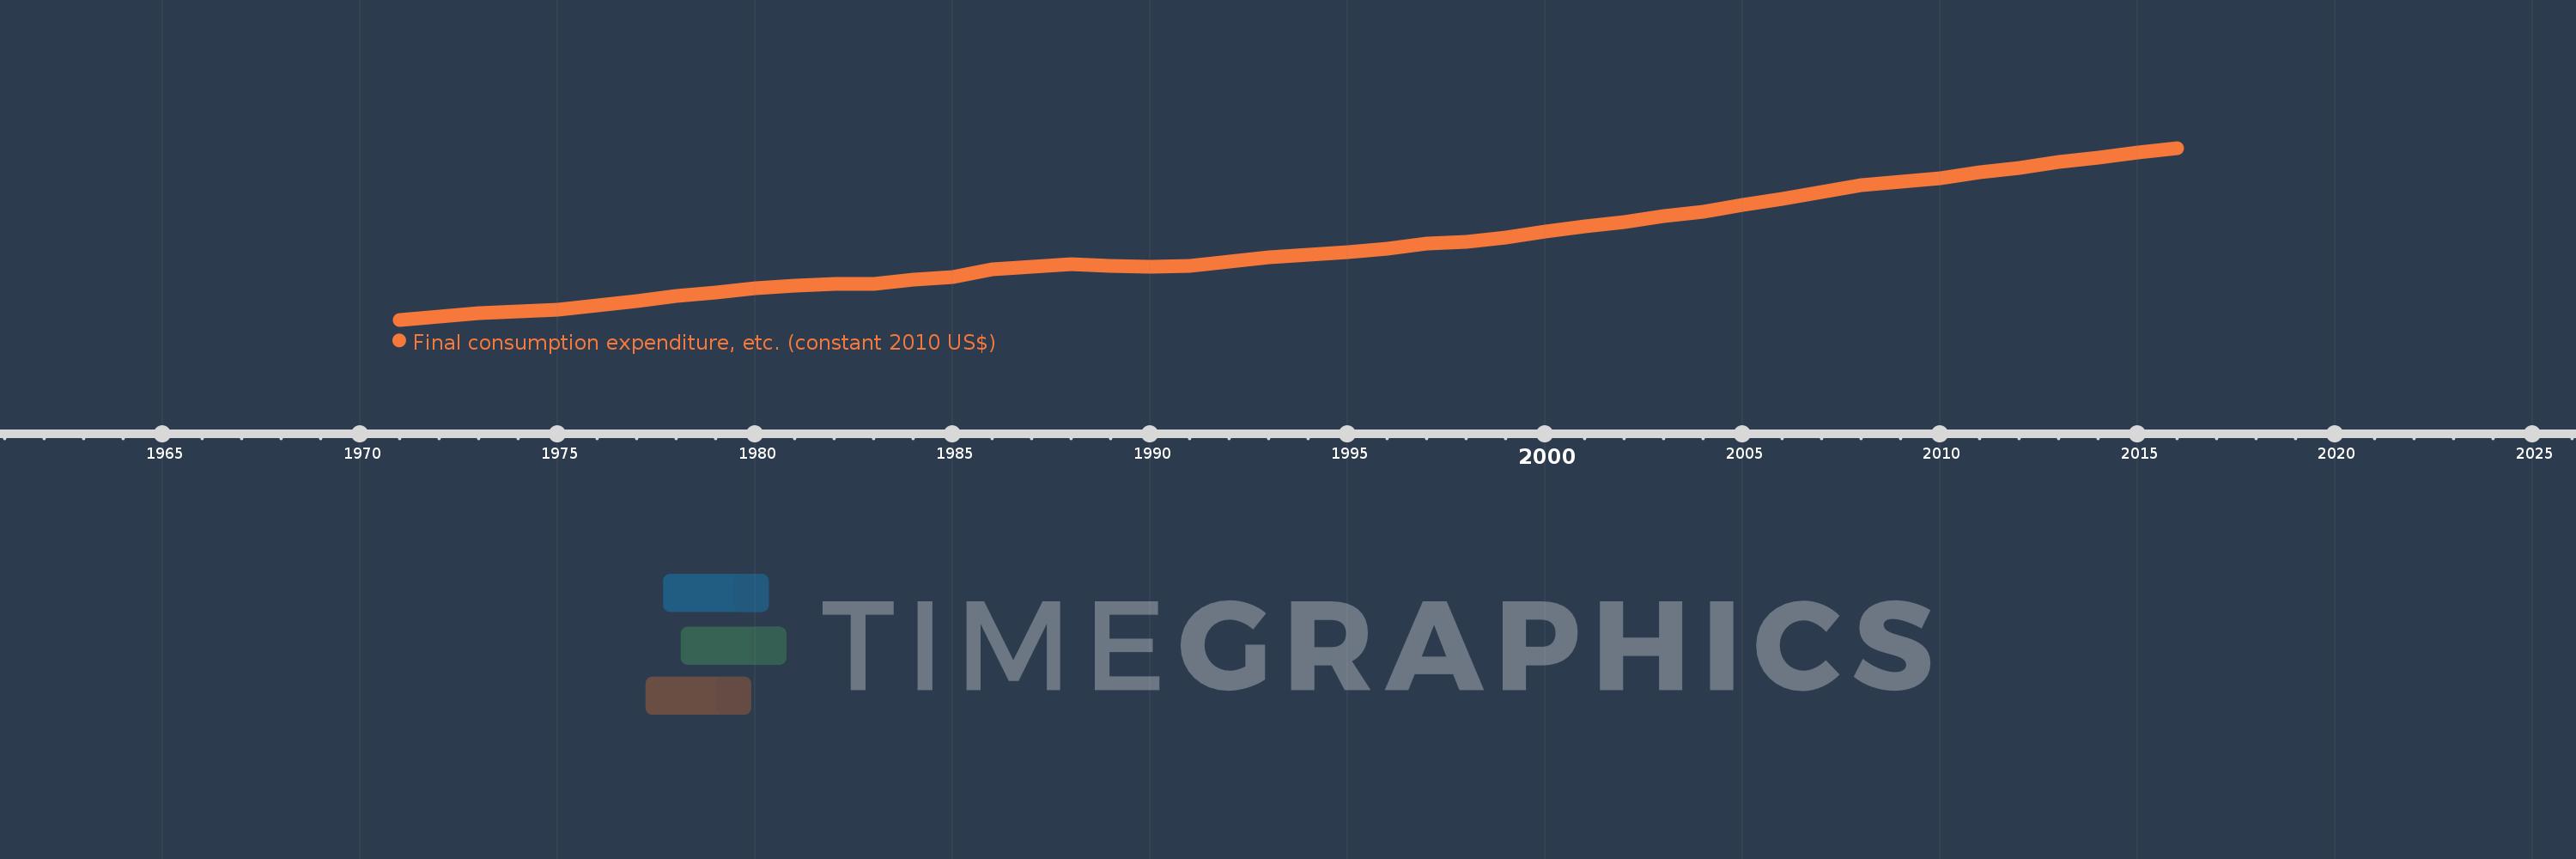
Final consumption expenditure, etc. (constant 2010 US$)
2016,2015,2014,2013,2012,2011,2010,2009,2008,2007,2006,2005,2004,2003,2002,2001,2000,1999,1998,1997,1996,1995,1994,1993,1992,1991,1990,1989,1988,1987,1986,1985,1984,1983,1982,1981,1980,1979,1978,1977,1976,1975,1974,1973,1972,1971
This statistics in other country:
AfghanistanAlbaniaAlgeriaAngolaAntigua and BarbudaArab WorldArgentinaArmeniaArubaAustraliaAustriaAzerbaijanBahamas, TheBahrainBangladeshBarbadosBelarusBelgiumBelizeBeninBermudaBhutanBoliviaBosnia and HerzegovinaBotswanaBrazilBrunei DarussalamBulgariaBurkina FasoBurundiCabo VerdeCambodiaCameroonCanadaCaribbean small statesCentral African RepublicCentral Europe and the BalticsChadChileChinaColombiaComorosCongo, Dem. Rep.Congo, Rep.Cote d'IvoireCroatiaCubaCyprusCzech RepublicDenmarkDominicaDominican RepublicEarly-demographic dividendEast Asia & PacificEast Asia & Pacific (excluding high income)East Asia & Pacific (IDA & IBRD countries)EcuadorEgypt, Arab Rep.El SalvadorEquatorial GuineaEritreaEstoniaEuro areaEurope & Central AsiaEurope & Central Asia (excluding high income)Europe & Central Asia (IDA & IBRD countries)European UnionFaroe IslandsFinlandFragile and conflict affected situationsFranceGabonGambia, TheGeorgiaGermanyGhanaGreeceGrenadaGuatemalaGuineaGuinea-BissauGuyanaHaitiHeavily indebted poor countries (HIPC)High incomeHondurasHong Kong SAR, ChinaHungaryIBRD onlyIcelandIDA & IBRD totalIDA blendIDA onlyIDA totalIndiaIndonesiaIran, Islamic Rep.IraqIrelandIsraelItalyJamaicaJapanJordanKazakhstanKenyaKorea, Rep.KosovoKuwaitKyrgyz RepublicLao PDRLate-demographic dividendLatin America & Caribbean Latin America & Caribbean (excluding high income)Latin America & the Caribbean (IDA & IBRD countries)LatviaLeast developed countries: UN classificationLebanonLiberiaLithuaniaLow & middle incomeLow incomeLower middle incomeLuxembourgMacao SAR, ChinaMacedonia, FYRMadagascarMalawiMalaysiaMaliMaltaMauritaniaMauritiusMexicoMiddle East & North AfricaMiddle East & North Africa (excluding high income)Middle East & North Africa (IDA & IBRD countries)Middle incomeMoldovaMongoliaMontenegroMoroccoMozambiqueNamibiaNepalNetherlandsNew ZealandNicaraguaNigerNigeriaNorth AmericaNorwayOECD membersOmanOther small statesPakistanPanamaParaguayPeruPhilippinesPolandPortugalPost-demographic dividendPre-demographic dividendPuerto RicoQatarRomaniaRussian FederationRwandaSaudi ArabiaSenegalSerbiaSeychellesSierra LeoneSingaporeSlovak RepublicSloveniaSmall statesSouth AfricaSouth AsiaSouth Asia (IDA & IBRD)South SudanSpainSri LankaSt. Kitts and NevisSt. LuciaSt. Vincent and the GrenadinesSub-Saharan Africa Sub-Saharan Africa (excluding high income)Sub-Saharan Africa (IDA & IBRD countries)SudanSurinameSwazilandSwedenSwitzerlandTajikistanTanzaniaThailandTimor-LesteTogoTongaTrinidad and TobagoTunisiaTurkeyTurkmenistanUgandaUkraineUnited Arab EmiratesUnited KingdomUnited StatesUpper middle incomeUruguayUzbekistanVanuatuVenezuela, RBVietnamWest Bank and GazaWorldYemen, Rep.ZambiaZimbabwe Timeline:
This timeline shows a graph from 1971 to 2016 of Norway. No data until 1970. Number of actual observations by date: 46.
Source name:
World Development Indicators
Source organization:
World Bank national accounts data, and OECD National Accounts data files.
Categories, topics:
Economy & Growth
Last updated:
apr 23, 2017
Indicators value changes by year
Minimum:
81.151 bln
jan 1, 1971
Maximum:
302.929 bln
jan 1, 2016
At the date of observation
Value
Absolute change
Change from previous value
jan 1, 1971
81.151 bln
+81.151 bln
0.0%
jan 1, 1972
85.317 bln
+4.166 bln
5.13%
jan 1, 1973
89.813 bln
+4.496 bln
5.27%
jan 1, 1974
92.083 bln
+2.271 bln
2.53%
jan 1, 1975
94.488 bln
+2.404 bln
2.61%
jan 1, 1976
100.049 bln
+5.561 bln
5.89%
jan 1, 1977
105.094 bln
+5.045 bln
5.04%
jan 1, 1978
111.437 bln
+6.343 bln
6.04%
jan 1, 1979
115.819 bln
+4.382 bln
3.93%
jan 1, 1980
121.579 bln
+5.761 bln
4.97%
jan 1, 1981
125.367 bln
+3.788 bln
3.12%
jan 1, 1982
126.908 bln
+1.541 bln
1.23%
jan 1, 1983
127.404 bln
+496.0 mln
0.39%
jan 1, 1984
132.733 bln
+5.329 bln
4.18%
jan 1, 1985
136.7 bln
+3.967 bln
2.99%
jan 1, 1986
146.196 bln
+9.497 bln
6.95%
jan 1, 1987
149.905 bln
+3.709 bln
2.54%
jan 1, 1988
153.05 bln
+3.144 bln
2.1%
jan 1, 1989
150.132 bln
-2.918 bln
-1.91%
jan 1, 1990
149.093 bln
-1.039 bln
-0.69%
jan 1, 1991
150.853 bln
+1.76 bln
1.18%
jan 1, 1992
155.963 bln
+5.109 bln
3.39%
jan 1, 1993
161.633 bln
+5.67 bln
3.64%
jan 1, 1994
165.463 bln
+3.831 bln
2.37%
jan 1, 1995
168.845 bln
+3.382 bln
2.04%
jan 1, 1996
172.773 bln
+3.928 bln
2.33%
jan 1, 1997
179.544 bln
+6.771 bln
3.92%
jan 1, 1998
182.226 bln
+2.682 bln
1.49%
jan 1, 1999
186.919 bln
+4.693 bln
2.58%
jan 1, 2000
194.624 bln
+7.706 bln
4.12%
jan 1, 2001
201.867 bln
+7.243 bln
3.72%
jan 1, 2002
207.684 bln
+5.817 bln
2.88%
jan 1, 2003
214.672 bln
+6.988 bln
3.36%
jan 1, 2004
220.958 bln
+6.286 bln
2.93%
jan 1, 2005
229.752 bln
+8.794 bln
3.98%
jan 1, 2006
237.45 bln
+7.698 bln
3.35%
jan 1, 2007
245.875 bln
+8.425 bln
3.55%
jan 1, 2008
255.152 bln
+9.277 bln
3.77%
jan 1, 2009
259.805 bln
+4.653 bln
1.82%
jan 1, 2010
263.483 bln
+3.678 bln
1.42%
jan 1, 2011
271.754 bln
+8.271 bln
3.14%
jan 1, 2012
276.867 bln
+5.113 bln
1.88%
jan 1, 2013
284.498 bln
+7.631 bln
2.76%
jan 1, 2014
290.296 bln
+5.798 bln
2.04%
jan 1, 2015
296.773 bln
+6.477 bln
2.23%
jan 1, 2016
302.929 bln
+6.155 bln
2.07%
Ranking of countries by current statistics by years


Comments: