29
/
en
AIzaSyAYiBZKx7MnpbEhh9jyipgxe19OcubqV5w
April 1, 2024
210327
Nicaragua
NIC
true
2
1
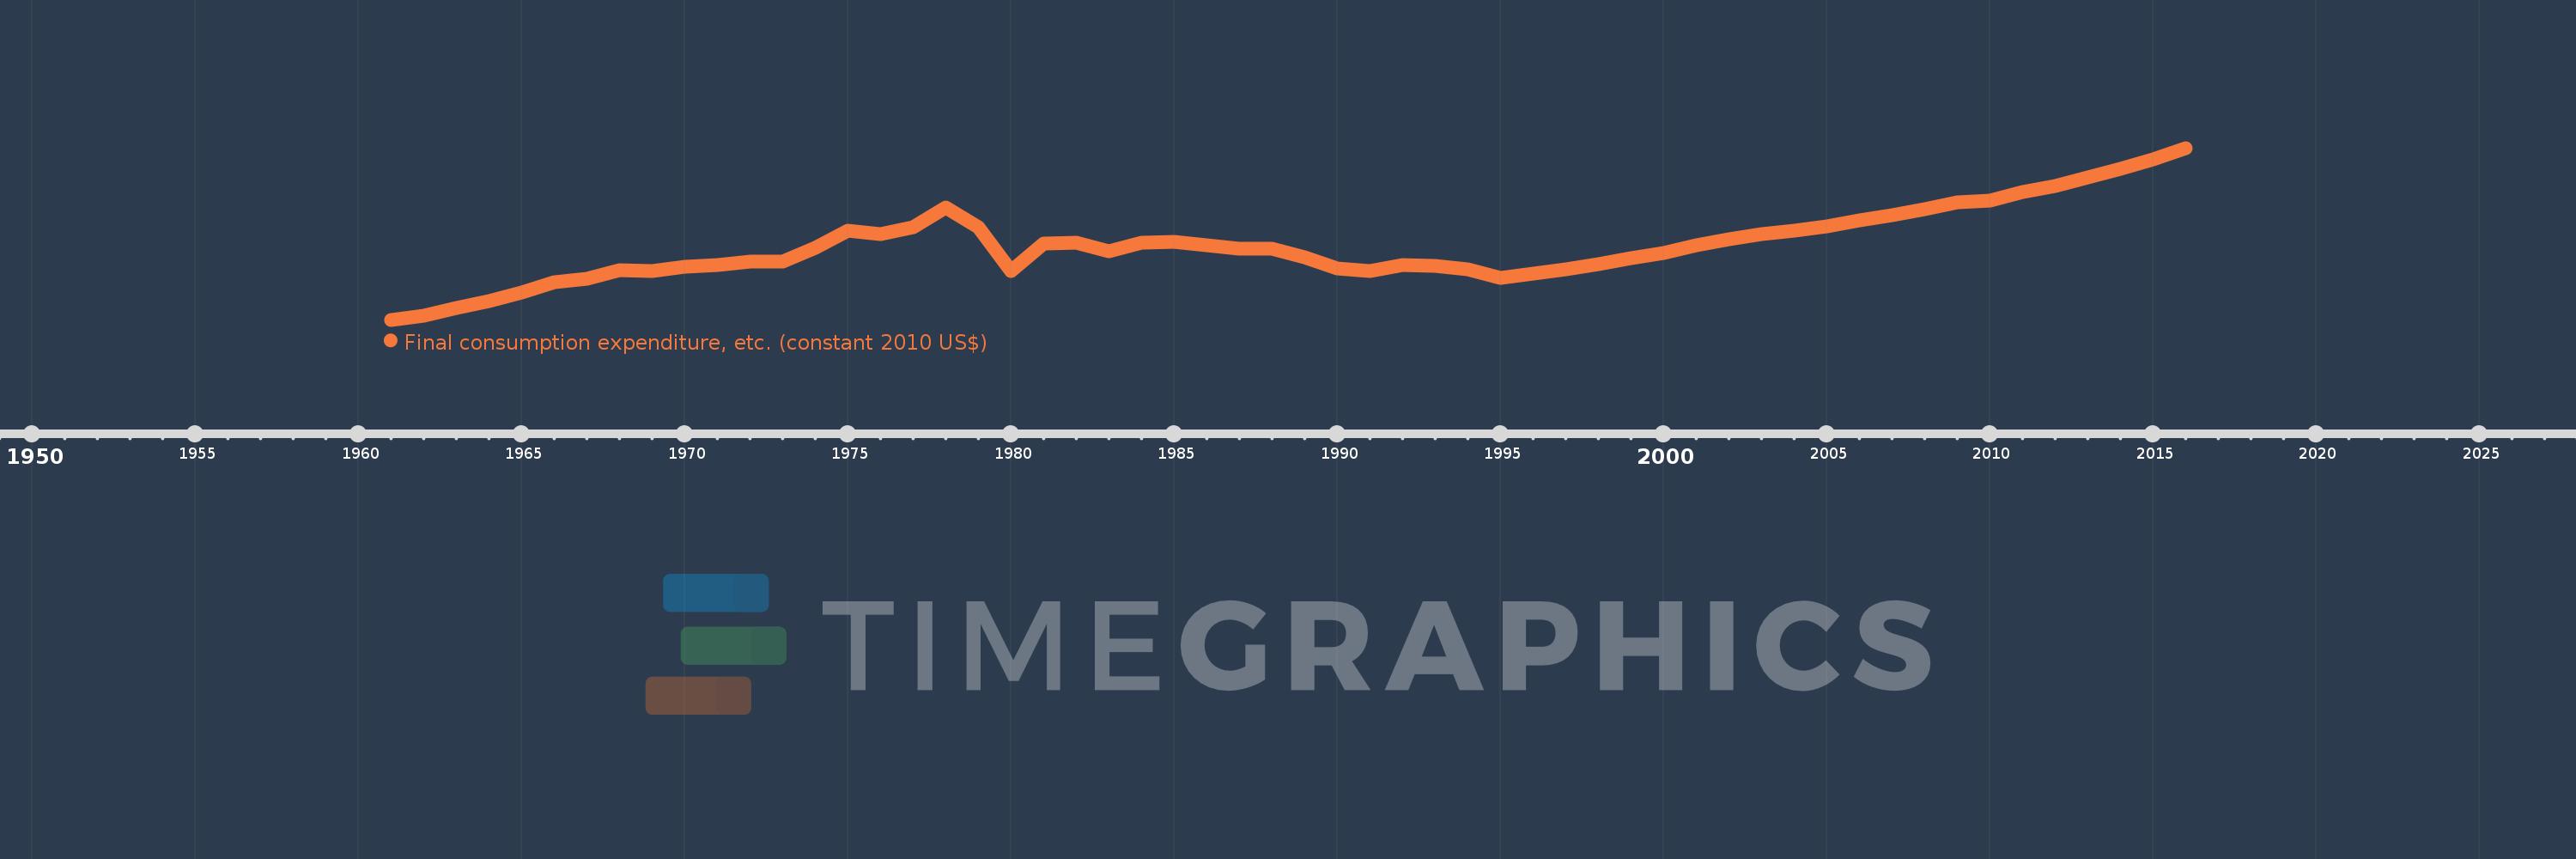
Final consumption expenditure, etc. (constant 2010 US$)
2016,2015,2014,2013,2012,2011,2010,2009,2008,2007,2006,2005,2004,2003,2002,2001,2000,1999,1998,1997,1996,1995,1994,1993,1992,1991,1990,1989,1988,1987,1986,1985,1984,1983,1982,1981,1980,1979,1978,1977,1976,1975,1974,1973,1972,1971,1970,1969,1968,1967,1966,1965,1964,1963,1962,1961
This statistics in other country:
AfghanistanAlbaniaAlgeriaAngolaAntigua and BarbudaArab WorldArgentinaArmeniaArubaAustraliaAustriaAzerbaijanBahamas, TheBahrainBangladeshBarbadosBelarusBelgiumBelizeBeninBermudaBhutanBoliviaBosnia and HerzegovinaBotswanaBrazilBrunei DarussalamBulgariaBurkina FasoBurundiCabo VerdeCambodiaCameroonCanadaCaribbean small statesCentral African RepublicCentral Europe and the BalticsChadChileChinaColombiaComorosCongo, Dem. Rep.Congo, Rep.Cote d'IvoireCroatiaCubaCyprusCzech RepublicDenmarkDominicaDominican RepublicEarly-demographic dividendEast Asia & PacificEast Asia & Pacific (excluding high income)East Asia & Pacific (IDA & IBRD countries)EcuadorEgypt, Arab Rep.El SalvadorEquatorial GuineaEritreaEstoniaEuro areaEurope & Central AsiaEurope & Central Asia (excluding high income)Europe & Central Asia (IDA & IBRD countries)European UnionFaroe IslandsFinlandFragile and conflict affected situationsFranceGabonGambia, TheGeorgiaGermanyGhanaGreeceGrenadaGuatemalaGuineaGuinea-BissauGuyanaHaitiHeavily indebted poor countries (HIPC)High incomeHondurasHong Kong SAR, ChinaHungaryIBRD onlyIcelandIDA & IBRD totalIDA blendIDA onlyIDA totalIndiaIndonesiaIran, Islamic Rep.IraqIrelandIsraelItalyJamaicaJapanJordanKazakhstanKenyaKorea, Rep.KosovoKuwaitKyrgyz RepublicLao PDRLate-demographic dividendLatin America & Caribbean Latin America & Caribbean (excluding high income)Latin America & the Caribbean (IDA & IBRD countries)LatviaLeast developed countries: UN classificationLebanonLiberiaLithuaniaLow & middle incomeLow incomeLower middle incomeLuxembourgMacao SAR, ChinaMacedonia, FYRMadagascarMalawiMalaysiaMaliMaltaMauritaniaMauritiusMexicoMiddle East & North AfricaMiddle East & North Africa (excluding high income)Middle East & North Africa (IDA & IBRD countries)Middle incomeMoldovaMongoliaMontenegroMoroccoMozambiqueNamibiaNepalNetherlandsNew ZealandNicaraguaNigerNigeriaNorth AmericaNorwayOECD membersOmanOther small statesPakistanPanamaParaguayPeruPhilippinesPolandPortugalPost-demographic dividendPre-demographic dividendPuerto RicoQatarRomaniaRussian FederationRwandaSaudi ArabiaSenegalSerbiaSeychellesSierra LeoneSingaporeSlovak RepublicSloveniaSmall statesSouth AfricaSouth AsiaSouth Asia (IDA & IBRD)South SudanSpainSri LankaSt. Kitts and NevisSt. LuciaSt. Vincent and the GrenadinesSub-Saharan Africa Sub-Saharan Africa (excluding high income)Sub-Saharan Africa (IDA & IBRD countries)SudanSurinameSwazilandSwedenSwitzerlandTajikistanTanzaniaThailandTimor-LesteTogoTongaTrinidad and TobagoTunisiaTurkeyTurkmenistanUgandaUkraineUnited Arab EmiratesUnited KingdomUnited StatesUpper middle incomeUruguayUzbekistanVanuatuVenezuela, RBVietnamWest Bank and GazaWorldYemen, Rep.ZambiaZimbabwe Timeline:
This timeline shows a graph from 1961 to 2016 of Nicaragua. No data until 1960. Number of actual observations by date: 56.
Source name:
World Development Indicators
Source organization:
World Bank national accounts data, and OECD National Accounts data files.
Categories, topics:
Economy & Growth
Last updated:
apr 23, 2017
Indicators value changes by year
Minimum:
2.65 bln
jan 1, 1961
Maximum:
10.222 bln
jan 1, 2016
At the date of observation
Value
Absolute change
Change from previous value
jan 1, 1961
2.65 bln
+2.65 bln
0.0%
jan 1, 1962
2.827 bln
+176.425 mln
6.66%
jan 1, 1963
3.184 bln
+357.251 mln
12.64%
jan 1, 1964
3.464 bln
+280.454 mln
8.81%
jan 1, 1965
3.862 bln
+397.83 mln
11.48%
jan 1, 1966
4.307 bln
+444.631 mln
11.51%
jan 1, 1967
4.46 bln
+153.186 mln
3.56%
jan 1, 1968
4.851 bln
+390.682 mln
8.76%
jan 1, 1969
4.783 bln
-67.198 mln
-1.39%
jan 1, 1970
4.979 bln
+195.485 mln
4.09%
jan 1, 1971
5.063 bln
+84.298 mln
1.69%
jan 1, 1972
5.195 bln
+132.271 mln
2.61%
jan 1, 1973
5.219 bln
+23.594 mln
0.45%
jan 1, 1974
5.818 bln
+599.191 mln
11.48%
jan 1, 1975
6.565 bln
+746.698 mln
12.83%
jan 1, 1976
6.417 bln
-148.272 mln
-2.26%
jan 1, 1977
6.73 bln
+313.229 mln
4.88%
jan 1, 1978
7.586 bln
+855.887 mln
12.72%
jan 1, 1979
6.745 bln
-840.534 mln
-11.08%
jan 1, 1980
4.811 bln
-1.934 bln
-28.67%
jan 1, 1981
6.002 bln
+1.191 bln
24.75%
jan 1, 1982
6.045 bln
+42.605 mln
0.71%
jan 1, 1983
5.667 bln
-377.402 mln
-6.24%
jan 1, 1984
6.045 bln
+377.971 mln
6.67%
jan 1, 1985
6.077 bln
+32.023 mln
0.53%
jan 1, 1986
5.925 bln
-152.336 mln
-2.51%
jan 1, 1987
5.768 bln
-156.903 mln
-2.65%
jan 1, 1988
5.782 bln
+14.082 mln
0.24%
jan 1, 1989
5.42 bln
-361.802 mln
-6.26%
jan 1, 1990
4.925 bln
-495.654 mln
-9.14%
jan 1, 1991
4.791 bln
-133.869 mln
-2.72%
jan 1, 1992
5.061 bln
+270.054 mln
5.64%
jan 1, 1993
5.03 bln
-30.653 mln
-0.61%
jan 1, 1994
4.868 bln
-162.631 mln
-3.23%
jan 1, 1995
4.487 bln
-380.883 mln
-7.82%
jan 1, 1996
4.696 bln
+209.381 mln
4.67%
jan 1, 1997
4.88 bln
+183.684 mln
3.91%
jan 1, 1998
5.101 bln
+221.247 mln
4.53%
jan 1, 1999
5.37 bln
+268.48 mln
5.26%
jan 1, 2000
5.597 bln
+227.104 mln
4.23%
jan 1, 2001
5.944 bln
+347.166 mln
6.2%
jan 1, 2002
6.216 bln
+272.448 mln
4.58%
jan 1, 2003
6.434 bln
+217.358 mln
3.5%
jan 1, 2004
6.595 bln
+161.37 mln
2.51%
jan 1, 2005
6.776 bln
+181.442 mln
2.75%
jan 1, 2006
7.026 bln
+249.526 mln
3.68%
jan 1, 2007
7.263 bln
+236.618 mln
3.37%
jan 1, 2008
7.527 bln
+264.012 mln
3.64%
jan 1, 2009
7.823 bln
+296.297 mln
3.94%
jan 1, 2010
7.91 bln
+86.672 mln
1.11%
jan 1, 2011
8.296 bln
+385.968 mln
4.88%
jan 1, 2012
8.53 bln
+234.627 mln
2.83%
jan 1, 2013
8.909 bln
+378.917 mln
4.44%
jan 1, 2014
9.289 bln
+379.629 mln
4.26%
jan 1, 2015
9.717 bln
+428.127 mln
4.61%
jan 1, 2016
10.222 bln
+505.511 mln
5.2%
Ranking of countries by current statistics by years


Comments: