30
/
AIzaSyAYiBZKx7MnpbEhh9jyipgxe19OcubqV5w
April 1, 2024
44218
Least developed countries: UN classification
LDC
false
2
1
Final consumption expenditure, etc. (constant 2010 US$)
2016,2015,2014,2013,2012,2011,2010,2009,2008,2007,2006,2005,2004,2003
Download
Global statistics library →Least developed countries: UN classification →

Final consumption expenditure, etc. (constant 2010 US$)

This statistics in other country:

AfghanistanAlbaniaAlgeriaAngolaAntigua and BarbudaArab WorldArgentinaArmeniaArubaAustraliaAustriaAzerbaijanBahamas, TheBahrainBangladeshBarbadosBelarusBelgiumBelizeBeninBermudaBhutanBoliviaBosnia and HerzegovinaBotswanaBrazilBrunei DarussalamBulgariaBurkina FasoBurundiCabo VerdeCambodiaCameroonCanadaCaribbean small statesCentral African RepublicCentral Europe and the BalticsChadChileChinaColombiaComorosCongo, Dem. Rep.Congo, Rep.Cote d'IvoireCroatiaCubaCyprusCzech RepublicDenmarkDominicaDominican RepublicEarly-demographic dividendEast Asia & PacificEast Asia & Pacific (excluding high income)East Asia & Pacific (IDA & IBRD countries)EcuadorEgypt, Arab Rep.El SalvadorEquatorial GuineaEritreaEstoniaEuro areaEurope & Central AsiaEurope & Central Asia (excluding high income)Europe & Central Asia (IDA & IBRD countries)European UnionFaroe IslandsFinlandFragile and conflict affected situationsFranceGabonGambia, TheGeorgiaGermanyGhanaGreeceGrenadaGuatemalaGuineaGuinea-BissauGuyanaHaitiHeavily indebted poor countries (HIPC)High incomeHondurasHong Kong SAR, ChinaHungaryIBRD onlyIcelandIDA & IBRD totalIDA blendIDA onlyIDA totalIndiaIndonesiaIran, Islamic Rep.IraqIrelandIsraelItalyJamaicaJapanJordanKazakhstanKenyaKorea, Rep.KosovoKuwaitKyrgyz RepublicLao PDRLate-demographic dividendLatin America & Caribbean Latin America & Caribbean (excluding high income)Latin America & the Caribbean (IDA & IBRD countries)LatviaLeast developed countries: UN classificationLebanonLiberiaLithuaniaLow & middle incomeLow incomeLower middle incomeLuxembourgMacao SAR, ChinaMacedonia, FYRMadagascarMalawiMalaysiaMaliMaltaMauritaniaMauritiusMexicoMiddle East & North AfricaMiddle East & North Africa (excluding high income)Middle East & North Africa (IDA & IBRD countries)Middle incomeMoldovaMongoliaMontenegroMoroccoMozambiqueNamibiaNepalNetherlandsNew ZealandNicaraguaNigerNigeriaNorth AmericaNorwayOECD membersOmanOther small statesPakistanPanamaParaguayPeruPhilippinesPolandPortugalPost-demographic dividendPre-demographic dividendPuerto RicoQatarRomaniaRussian FederationRwandaSaudi ArabiaSenegalSerbiaSeychellesSierra LeoneSingaporeSlovak RepublicSloveniaSmall statesSouth AfricaSouth AsiaSouth Asia (IDA & IBRD)South SudanSpainSri LankaSt. Kitts and NevisSt. LuciaSt. Vincent and the GrenadinesSub-Saharan Africa Sub-Saharan Africa (excluding high income)Sub-Saharan Africa (IDA & IBRD countries)SudanSurinameSwazilandSwedenSwitzerlandTajikistanTanzaniaThailandTimor-LesteTogoTongaTrinidad and TobagoTunisiaTurkeyTurkmenistanUgandaUkraineUnited Arab EmiratesUnited KingdomUnited StatesUpper middle incomeUruguayUzbekistanVanuatuVenezuela, RBVietnamWest Bank and GazaWorldYemen, Rep.ZambiaZimbabwe

Timeline:

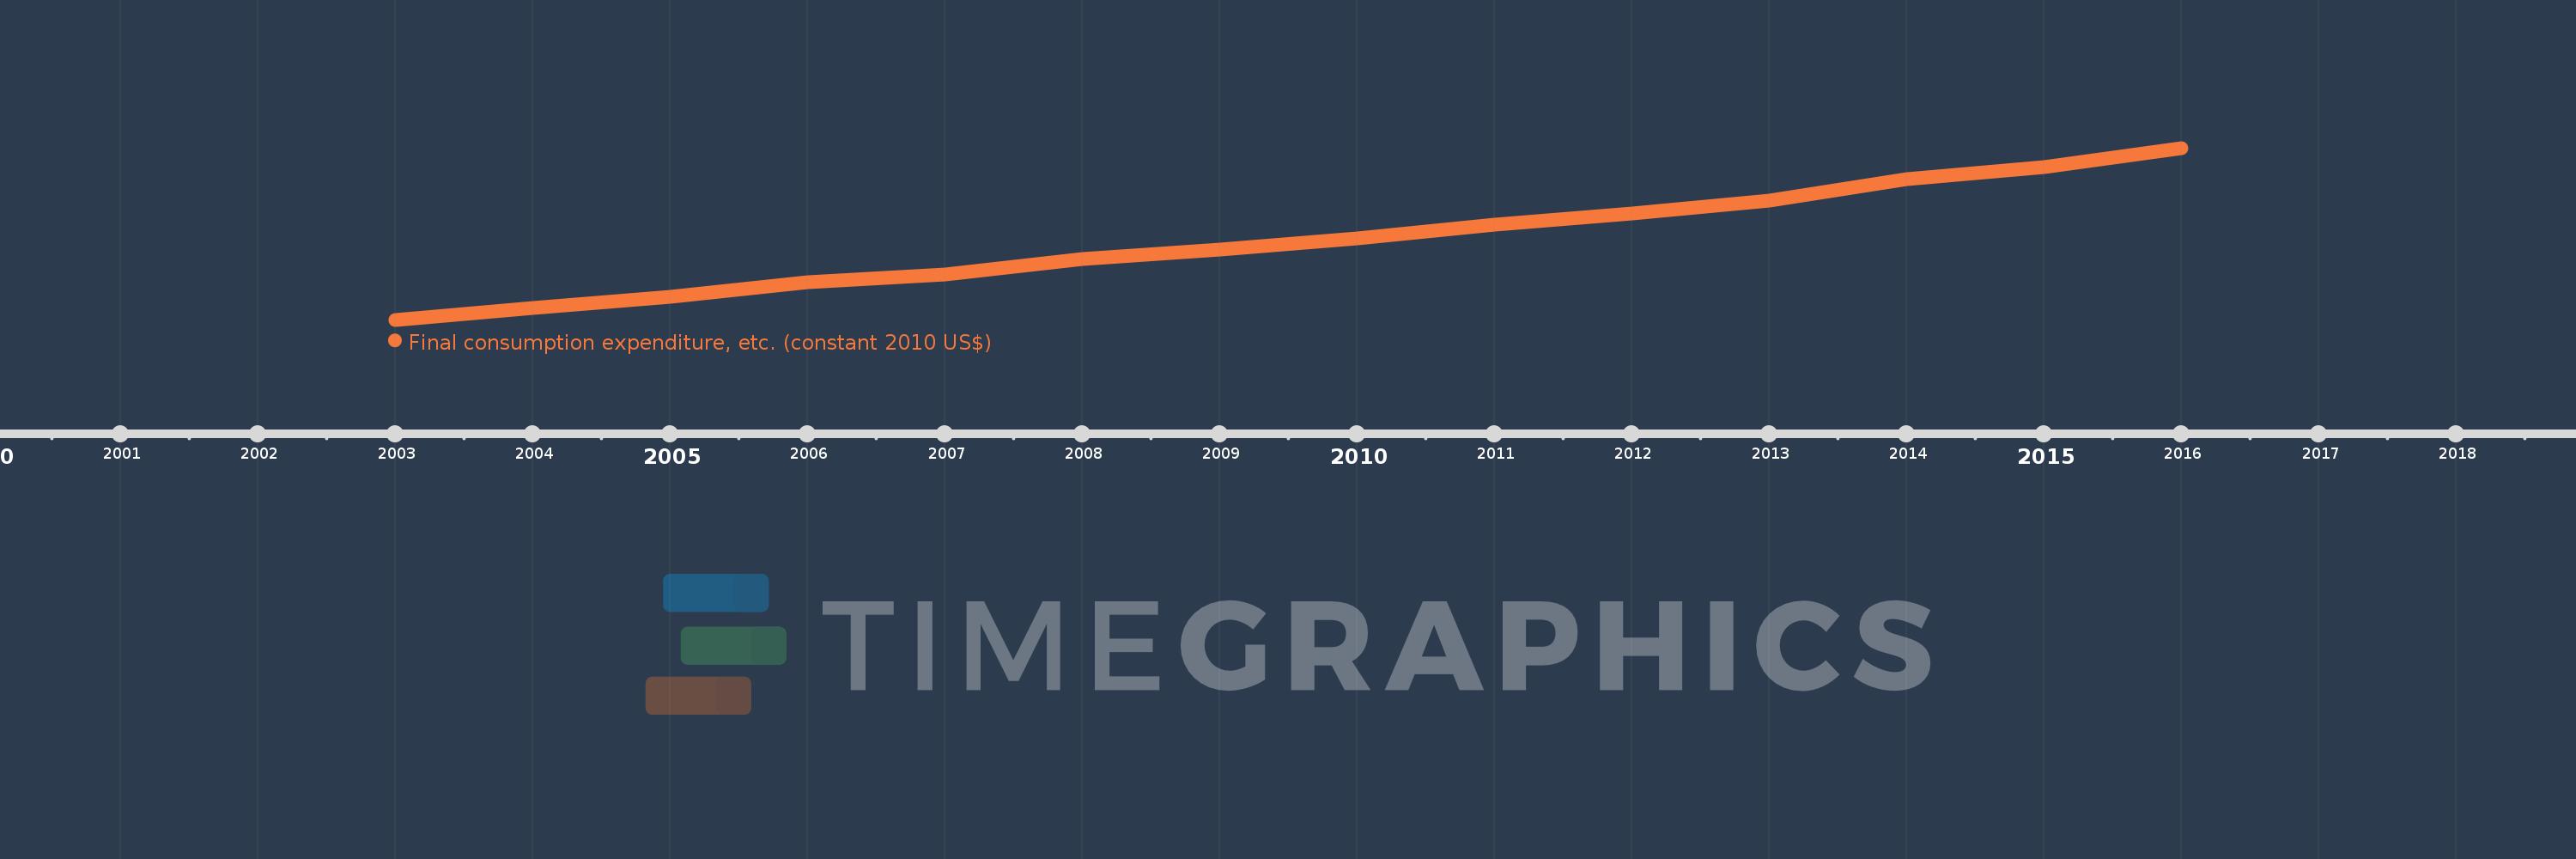
This timeline shows a graph from 2003 to 2016 of Least developed countries: UN classification. No data until 2002. Number of actual observations by date: 14.

Source name:

World Development Indicators

Source organization:

World Bank national accounts data, and OECD National Accounts data files.

Categories, topics:

Economy & Growth

Last updated:

apr 23, 2017

Indicators value changes by year

Meaning:
523.085 bln
Minimum:
366.534 bln
jan 1, 2003
Maximum:
704.051 bln
jan 1, 2016
At the date of observation
Value
Absolute change
Change from the previous value
jan 1, 2003
366.534 bln
+366.534 bln
0.0%
jan 1, 2004
389.416 bln
+22.882 bln
6.24%
jan 1, 2005
411.784 bln
+22.368 bln
5.74%
jan 1, 2006
439.897 bln
+28.113 bln
6.83%
jan 1, 2007
455.994 bln
+16.097 bln
3.66%
jan 1, 2008
486.436 bln
+30.442 bln
6.68%
jan 1, 2009
503.711 bln
+17.274 bln
3.55%
jan 1, 2010
525.618 bln
+21.907 bln
4.35%
jan 1, 2011
552.808 bln
+27.19 bln
5.17%
jan 1, 2012
575.045 bln
+22.237 bln
4.02%
jan 1, 2013
601.264 bln
+26.218 bln
4.56%
jan 1, 2014
643.61 bln
+42.346 bln
7.04%
jan 1, 2015
667.027 bln
+23.417 bln
3.64%
jan 1, 2016
704.051 bln
+37.024 bln
5.55%

Ranking of countries by current statistics by years