29
/
en
AIzaSyAYiBZKx7MnpbEhh9jyipgxe19OcubqV5w
April 1, 2024
84047
Benin
BEN
true
2
1
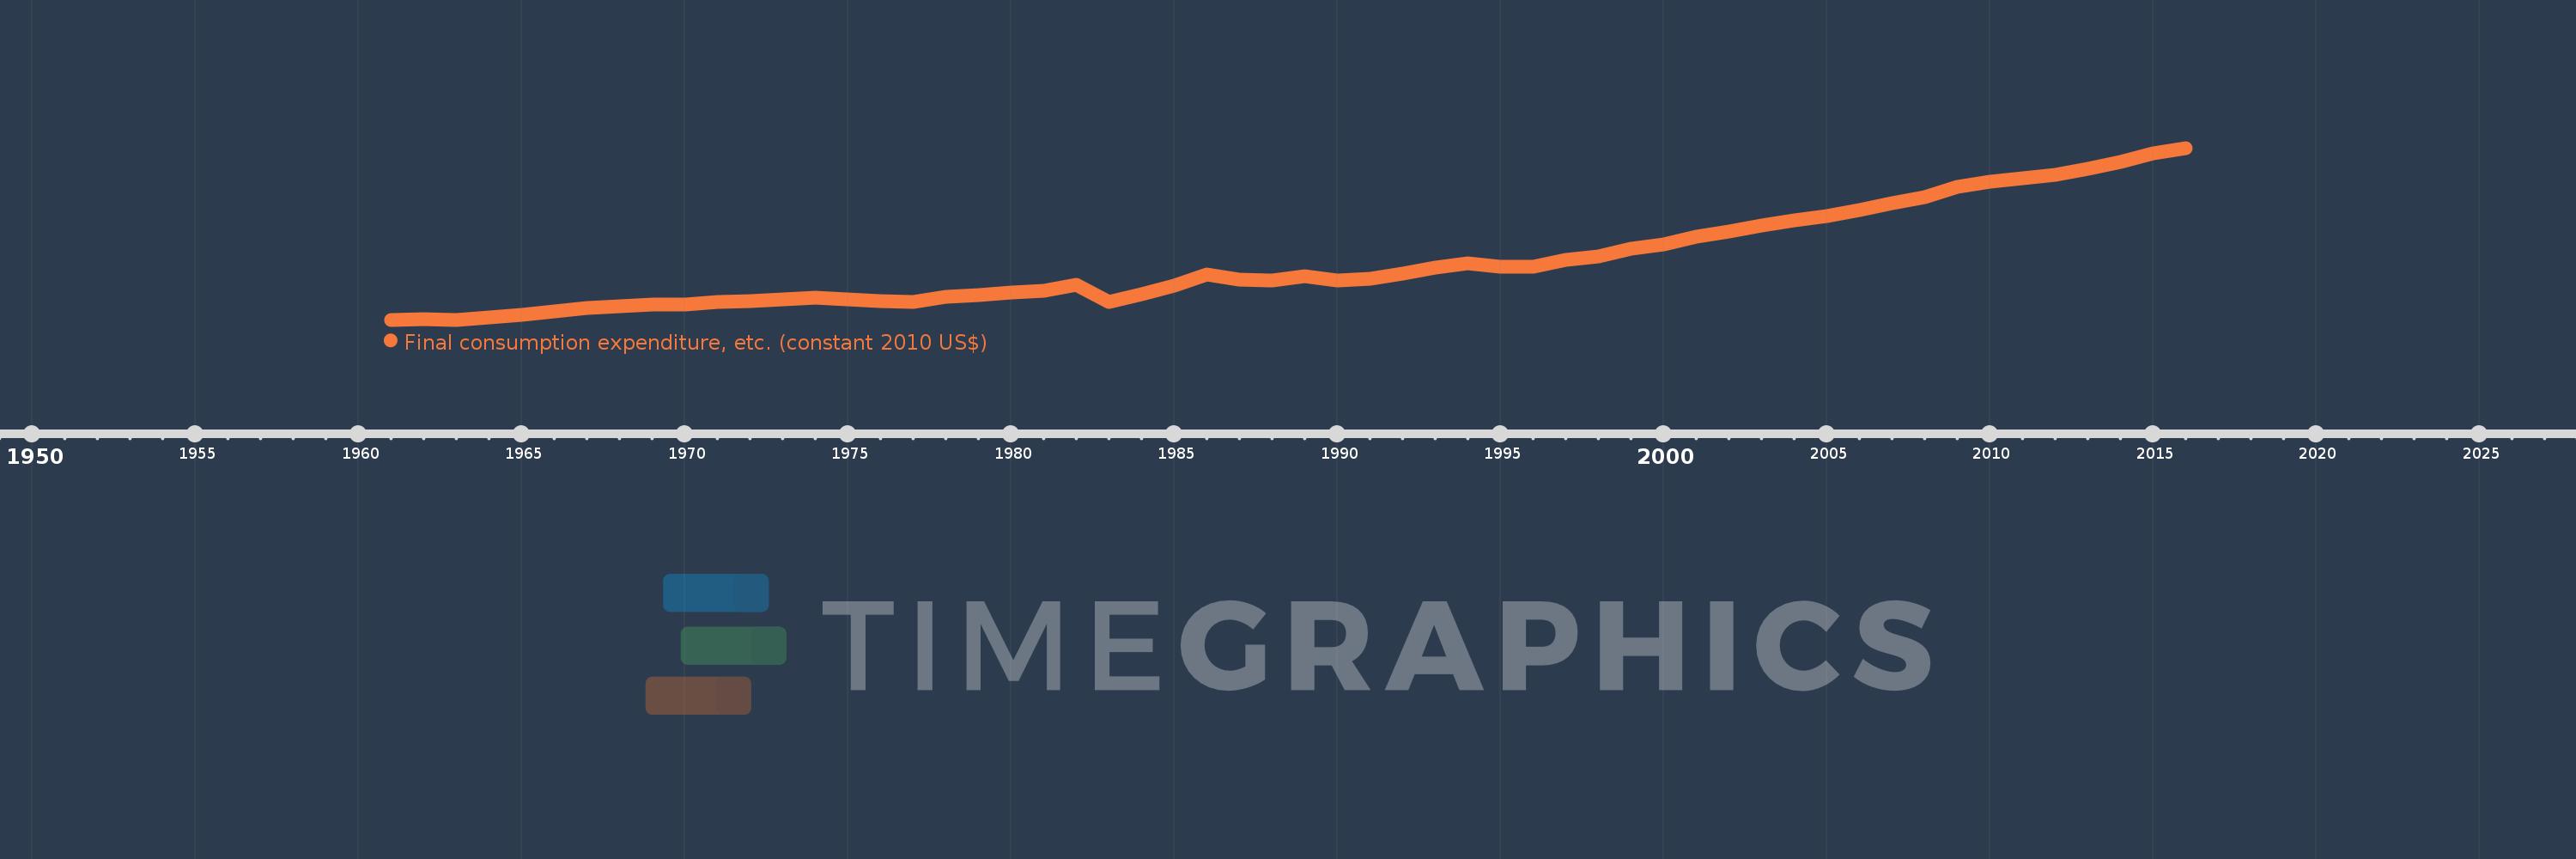
Final consumption expenditure, etc. (constant 2010 US$)
2016,2015,2014,2013,2012,2011,2010,2009,2008,2007,2006,2005,2004,2003,2002,2001,2000,1999,1998,1997,1996,1995,1994,1993,1992,1991,1990,1989,1988,1987,1986,1985,1984,1983,1982,1981,1980,1979,1978,1977,1976,1975,1974,1973,1972,1971,1970,1969,1968,1967,1966,1965,1964,1963,1962,1961
This statistics in other country:
AfghanistanAlbaniaAlgeriaAngolaAntigua and BarbudaArab WorldArgentinaArmeniaArubaAustraliaAustriaAzerbaijanBahamas, TheBahrainBangladeshBarbadosBelarusBelgiumBelizeBeninBermudaBhutanBoliviaBosnia and HerzegovinaBotswanaBrazilBrunei DarussalamBulgariaBurkina FasoBurundiCabo VerdeCambodiaCameroonCanadaCaribbean small statesCentral African RepublicCentral Europe and the BalticsChadChileChinaColombiaComorosCongo, Dem. Rep.Congo, Rep.Cote d'IvoireCroatiaCubaCyprusCzech RepublicDenmarkDominicaDominican RepublicEarly-demographic dividendEast Asia & PacificEast Asia & Pacific (excluding high income)East Asia & Pacific (IDA & IBRD countries)EcuadorEgypt, Arab Rep.El SalvadorEquatorial GuineaEritreaEstoniaEuro areaEurope & Central AsiaEurope & Central Asia (excluding high income)Europe & Central Asia (IDA & IBRD countries)European UnionFaroe IslandsFinlandFragile and conflict affected situationsFranceGabonGambia, TheGeorgiaGermanyGhanaGreeceGrenadaGuatemalaGuineaGuinea-BissauGuyanaHaitiHeavily indebted poor countries (HIPC)High incomeHondurasHong Kong SAR, ChinaHungaryIBRD onlyIcelandIDA & IBRD totalIDA blendIDA onlyIDA totalIndiaIndonesiaIran, Islamic Rep.IraqIrelandIsraelItalyJamaicaJapanJordanKazakhstanKenyaKorea, Rep.KosovoKuwaitKyrgyz RepublicLao PDRLate-demographic dividendLatin America & Caribbean Latin America & Caribbean (excluding high income)Latin America & the Caribbean (IDA & IBRD countries)LatviaLeast developed countries: UN classificationLebanonLiberiaLithuaniaLow & middle incomeLow incomeLower middle incomeLuxembourgMacao SAR, ChinaMacedonia, FYRMadagascarMalawiMalaysiaMaliMaltaMauritaniaMauritiusMexicoMiddle East & North AfricaMiddle East & North Africa (excluding high income)Middle East & North Africa (IDA & IBRD countries)Middle incomeMoldovaMongoliaMontenegroMoroccoMozambiqueNamibiaNepalNetherlandsNew ZealandNicaraguaNigerNigeriaNorth AmericaNorwayOECD membersOmanOther small statesPakistanPanamaParaguayPeruPhilippinesPolandPortugalPost-demographic dividendPre-demographic dividendPuerto RicoQatarRomaniaRussian FederationRwandaSaudi ArabiaSenegalSerbiaSeychellesSierra LeoneSingaporeSlovak RepublicSloveniaSmall statesSouth AfricaSouth AsiaSouth Asia (IDA & IBRD)South SudanSpainSri LankaSt. Kitts and NevisSt. LuciaSt. Vincent and the GrenadinesSub-Saharan Africa Sub-Saharan Africa (excluding high income)Sub-Saharan Africa (IDA & IBRD countries)SudanSurinameSwazilandSwedenSwitzerlandTajikistanTanzaniaThailandTimor-LesteTogoTongaTrinidad and TobagoTunisiaTurkeyTurkmenistanUgandaUkraineUnited Arab EmiratesUnited KingdomUnited StatesUpper middle incomeUruguayUzbekistanVanuatuVenezuela, RBVietnamWest Bank and GazaWorldYemen, Rep.ZambiaZimbabwe Timeline:
This timeline shows a graph from 1961 to 2016 of Benin. No data until 1960. Number of actual observations by date: 56.
Source name:
World Development Indicators
Source organization:
World Bank national accounts data, and OECD National Accounts data files.
Categories, topics:
Economy & Growth
Last updated:
apr 23, 2017
Indicators value changes by year
Minimum:
1.226 bln
jan 1, 1963
Maximum:
7.388 bln
jan 1, 2016
At the date of observation
Value
Absolute change
Change from previous value
jan 1, 1961
1.23 bln
+1.23 bln
0.0%
jan 1, 1962
1.246 bln
+15.735 mln
1.28%
jan 1, 1963
1.226 bln
-19.441 mln
-1.56%
jan 1, 1964
1.311 bln
+84.436 mln
6.89%
jan 1, 1965
1.416 bln
+105.232 mln
8.03%
jan 1, 1966
1.534 bln
+118.61 mln
8.38%
jan 1, 1967
1.66 bln
+125.391 mln
8.17%
jan 1, 1968
1.706 bln
+46.202 mln
2.78%
jan 1, 1969
1.759 bln
+52.582 mln
3.08%
jan 1, 1970
1.786 bln
+26.977 mln
1.53%
jan 1, 1971
1.859 bln
+73.651 mln
4.12%
jan 1, 1972
1.904 bln
+44.865 mln
2.41%
jan 1, 1973
1.954 bln
+49.741 mln
2.61%
jan 1, 1974
2.025 bln
+70.764 mln
3.62%
jan 1, 1975
1.941 bln
-83.449 mln
-4.12%
jan 1, 1976
1.895 bln
-46.36 mln
-2.39%
jan 1, 1977
1.855 bln
-39.847 mln
-2.1%
jan 1, 1978
2.043 bln
+188.324 mln
10.15%
jan 1, 1979
2.117 bln
+73.46 mln
3.6%
jan 1, 1980
2.2 bln
+83.683 mln
3.95%
jan 1, 1981
2.277 bln
+76.17 mln
3.46%
jan 1, 1982
2.467 bln
+190.017 mln
8.35%
jan 1, 1983
1.875 bln
-591.837 mln
-23.99%
jan 1, 1984
2.142 bln
+267.699 mln
14.28%
jan 1, 1985
2.448 bln
+305.974 mln
14.28%
jan 1, 1986
2.861 bln
+412.26 mln
16.84%
jan 1, 1987
2.675 bln
-185.891 mln
-6.5%
jan 1, 1988
2.629 bln
-45.858 mln
-1.71%
jan 1, 1989
2.778 bln
+149.048 mln
5.67%
jan 1, 1990
2.648 bln
-129.543 mln
-4.66%
jan 1, 1991
2.691 bln
+43.105 mln
1.63%
jan 1, 1992
2.895 bln
+203.852 mln
7.57%
jan 1, 1993
3.098 bln
+203.069 mln
7.01%
jan 1, 1994
3.26 bln
+161.187 mln
5.2%
jan 1, 1995
3.137 bln
-122.677 mln
-3.76%
jan 1, 1996
3.123 bln
-14.126 mln
-0.45%
jan 1, 1997
3.372 bln
+249.661 mln
7.99%
jan 1, 1998
3.504 bln
+131.653 mln
3.9%
jan 1, 1999
3.768 bln
+264.173 mln
7.54%
jan 1, 2000
3.931 bln
+162.627 mln
4.32%
jan 1, 2001
4.214 bln
+283.057 mln
7.2%
jan 1, 2002
4.378 bln
+164.12 mln
3.89%
jan 1, 2003
4.621 bln
+242.747 mln
5.54%
jan 1, 2004
4.796 bln
+175.637 mln
3.8%
jan 1, 2005
4.935 bln
+138.206 mln
2.88%
jan 1, 2006
5.166 bln
+231.23 mln
4.69%
jan 1, 2007
5.4 bln
+234.331 mln
4.54%
jan 1, 2008
5.611 bln
+210.853 mln
3.9%
jan 1, 2009
6.002 bln
+390.699 mln
6.96%
jan 1, 2010
6.192 bln
+190.255 mln
3.17%
jan 1, 2011
6.293 bln
+100.997 mln
1.63%
jan 1, 2012
6.436 bln
+143.079 mln
2.27%
jan 1, 2013
6.637 bln
+200.444 mln
3.11%
jan 1, 2014
6.897 bln
+260.466 mln
3.92%
jan 1, 2015
7.184 bln
+286.823 mln
4.16%
jan 1, 2016
7.388 bln
+204.43 mln
2.85%
Ranking of countries by current statistics by years


Comments: