29
/
en
AIzaSyAYiBZKx7MnpbEhh9jyipgxe19OcubqV5w
April 1, 2024
151545
Hong Kong SAR, China
HKG
true
2
1
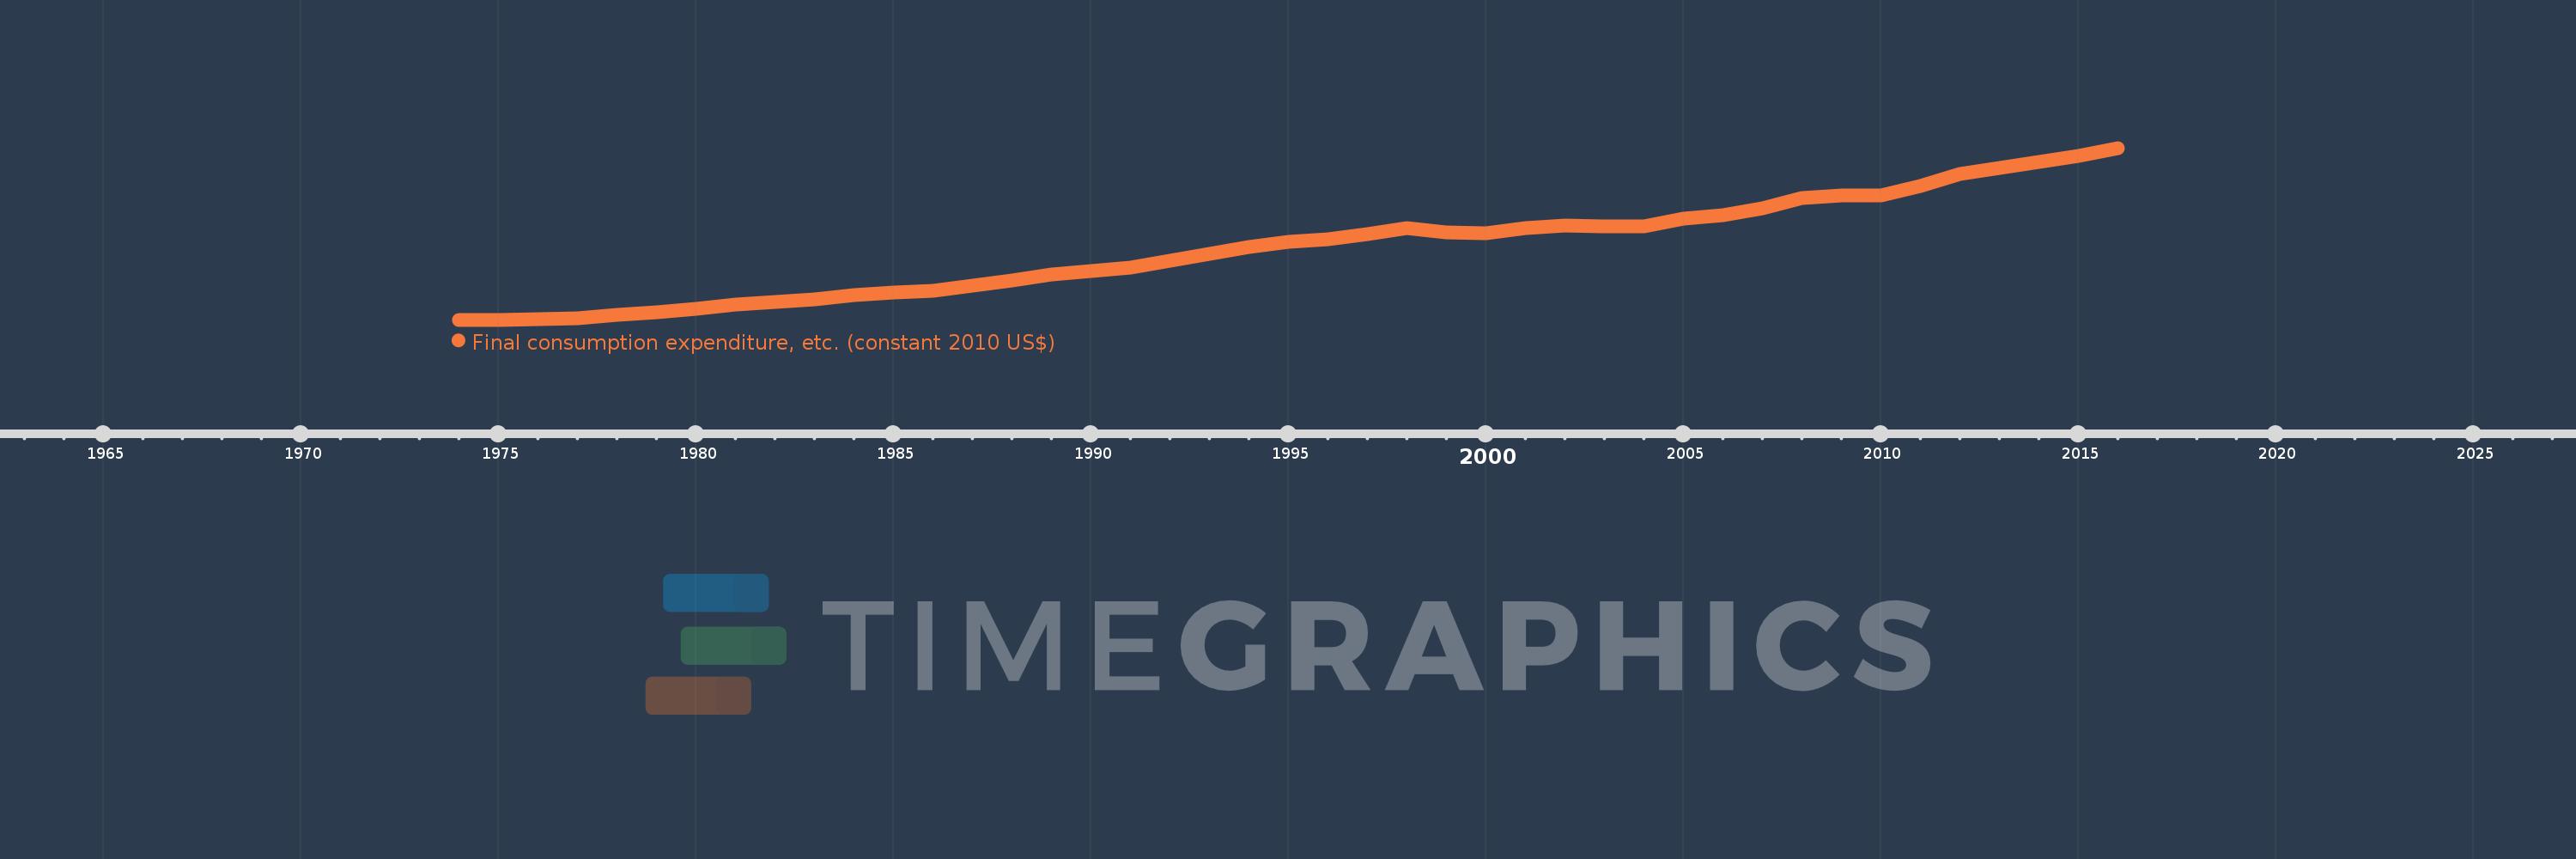
Final consumption expenditure, etc. (constant 2010 US$)
2016,2015,2014,2013,2012,2011,2010,2009,2008,2007,2006,2005,2004,2003,2002,2001,2000,1999,1998,1997,1996,1995,1994,1993,1992,1991,1990,1989,1988,1987,1986,1985,1984,1983,1982,1981,1980,1979,1978,1977,1976,1975,1974
This statistics in other country:
AfghanistanAlbaniaAlgeriaAngolaAntigua and BarbudaArab WorldArgentinaArmeniaArubaAustraliaAustriaAzerbaijanBahamas, TheBahrainBangladeshBarbadosBelarusBelgiumBelizeBeninBermudaBhutanBoliviaBosnia and HerzegovinaBotswanaBrazilBrunei DarussalamBulgariaBurkina FasoBurundiCabo VerdeCambodiaCameroonCanadaCaribbean small statesCentral African RepublicCentral Europe and the BalticsChadChileChinaColombiaComorosCongo, Dem. Rep.Congo, Rep.Cote d'IvoireCroatiaCubaCyprusCzech RepublicDenmarkDominicaDominican RepublicEarly-demographic dividendEast Asia & PacificEast Asia & Pacific (excluding high income)East Asia & Pacific (IDA & IBRD countries)EcuadorEgypt, Arab Rep.El SalvadorEquatorial GuineaEritreaEstoniaEuro areaEurope & Central AsiaEurope & Central Asia (excluding high income)Europe & Central Asia (IDA & IBRD countries)European UnionFaroe IslandsFinlandFragile and conflict affected situationsFranceGabonGambia, TheGeorgiaGermanyGhanaGreeceGrenadaGuatemalaGuineaGuinea-BissauGuyanaHaitiHeavily indebted poor countries (HIPC)High incomeHondurasHong Kong SAR, ChinaHungaryIBRD onlyIcelandIDA & IBRD totalIDA blendIDA onlyIDA totalIndiaIndonesiaIran, Islamic Rep.IraqIrelandIsraelItalyJamaicaJapanJordanKazakhstanKenyaKorea, Rep.KosovoKuwaitKyrgyz RepublicLao PDRLate-demographic dividendLatin America & Caribbean Latin America & Caribbean (excluding high income)Latin America & the Caribbean (IDA & IBRD countries)LatviaLeast developed countries: UN classificationLebanonLiberiaLithuaniaLow & middle incomeLow incomeLower middle incomeLuxembourgMacao SAR, ChinaMacedonia, FYRMadagascarMalawiMalaysiaMaliMaltaMauritaniaMauritiusMexicoMiddle East & North AfricaMiddle East & North Africa (excluding high income)Middle East & North Africa (IDA & IBRD countries)Middle incomeMoldovaMongoliaMontenegroMoroccoMozambiqueNamibiaNepalNetherlandsNew ZealandNicaraguaNigerNigeriaNorth AmericaNorwayOECD membersOmanOther small statesPakistanPanamaParaguayPeruPhilippinesPolandPortugalPost-demographic dividendPre-demographic dividendPuerto RicoQatarRomaniaRussian FederationRwandaSaudi ArabiaSenegalSerbiaSeychellesSierra LeoneSingaporeSlovak RepublicSloveniaSmall statesSouth AfricaSouth AsiaSouth Asia (IDA & IBRD)South SudanSpainSri LankaSt. Kitts and NevisSt. LuciaSt. Vincent and the GrenadinesSub-Saharan Africa Sub-Saharan Africa (excluding high income)Sub-Saharan Africa (IDA & IBRD countries)SudanSurinameSwazilandSwedenSwitzerlandTajikistanTanzaniaThailandTimor-LesteTogoTongaTrinidad and TobagoTunisiaTurkeyTurkmenistanUgandaUkraineUnited Arab EmiratesUnited KingdomUnited StatesUpper middle incomeUruguayUzbekistanVanuatuVenezuela, RBVietnamWest Bank and GazaWorldYemen, Rep.ZambiaZimbabwe Timeline:
This timeline shows a graph from 1974 to 2016 of Hong Kong SAR, China. No data until 1973. Number of actual observations by date: 43.
Source name:
World Development Indicators
Source organization:
World Bank national accounts data, and OECD National Accounts data files.
Categories, topics:
Economy & Growth
Last updated:
apr 23, 2017
Indicators value changes by year
Minimum:
19.635 bln
jan 1, 1975
Maximum:
200.859 bln
jan 1, 2016
At the date of observation
Value
Absolute change
Change from previous value
jan 1, 1974
19.688 bln
+19.688 bln
0.0%
jan 1, 1975
19.635 bln
-53.051 mln
-0.27%
jan 1, 1976
20.535 bln
+900.069 mln
4.58%
jan 1, 1977
21.26 bln
+725.472 mln
3.53%
jan 1, 1978
24.392 bln
+3.132 bln
14.73%
jan 1, 1979
27.236 bln
+2.843 bln
11.66%
jan 1, 1980
31.046 bln
+3.81 bln
13.99%
jan 1, 1981
35.258 bln
+4.212 bln
13.57%
jan 1, 1982
38.385 bln
+3.127 bln
8.87%
jan 1, 1983
41.378 bln
+2.993 bln
7.8%
jan 1, 1984
45.52 bln
+4.142 bln
10.01%
jan 1, 1985
48.609 bln
+3.089 bln
6.79%
jan 1, 1986
50.234 bln
+1.626 bln
3.34%
jan 1, 1987
55.168 bln
+4.934 bln
9.82%
jan 1, 1988
61.376 bln
+6.208 bln
11.25%
jan 1, 1989
67.514 bln
+6.139 bln
10.0%
jan 1, 1990
70.587 bln
+3.072 bln
4.55%
jan 1, 1991
74.718 bln
+4.132 bln
5.85%
jan 1, 1992
81.593 bln
+6.875 bln
9.2%
jan 1, 1993
89.267 bln
+7.673 bln
9.4%
jan 1, 1994
95.955 bln
+6.688 bln
7.49%
jan 1, 1995
102.176 bln
+6.222 bln
6.48%
jan 1, 1996
104.655 bln
+2.479 bln
2.43%
jan 1, 1997
109.867 bln
+5.211 bln
4.98%
jan 1, 1998
116.613 bln
+6.746 bln
6.14%
jan 1, 1999
111.894 bln
-4.719 bln
-4.05%
jan 1, 2000
110.988 bln
-905.889 mln
-0.81%
jan 1, 2001
115.933 bln
+4.945 bln
4.46%
jan 1, 2002
118.694 bln
+2.761 bln
2.38%
jan 1, 2003
118.085 bln
-609.186 mln
-0.51%
jan 1, 2004
118.117 bln
+32.569 mln
0.03%
jan 1, 2005
126.065 bln
+7.947 bln
6.73%
jan 1, 2006
129.595 bln
+3.53 bln
2.8%
jan 1, 2007
136.713 bln
+7.118 bln
5.49%
jan 1, 2008
147.681 bln
+10.968 bln
8.02%
jan 1, 2009
150.587 bln
+2.907 bln
1.97%
jan 1, 2010
151.046 bln
+459.212 mln
0.3%
jan 1, 2011
160.583 bln
+9.537 bln
6.31%
jan 1, 2012
173.15 bln
+12.566 bln
7.83%
jan 1, 2013
180.0 bln
+6.851 bln
3.96%
jan 1, 2014
186.023 bln
+6.023 bln
3.35%
jan 1, 2015
192.192 bln
+6.169 bln
3.32%
jan 1, 2016
200.859 bln
+8.667 bln
4.51%
Ranking of countries by current statistics by years


Comments: