29
/
en
AIzaSyAYiBZKx7MnpbEhh9jyipgxe19OcubqV5w
April 1, 2024
94494
Burkina Faso
BFA
true
2
1
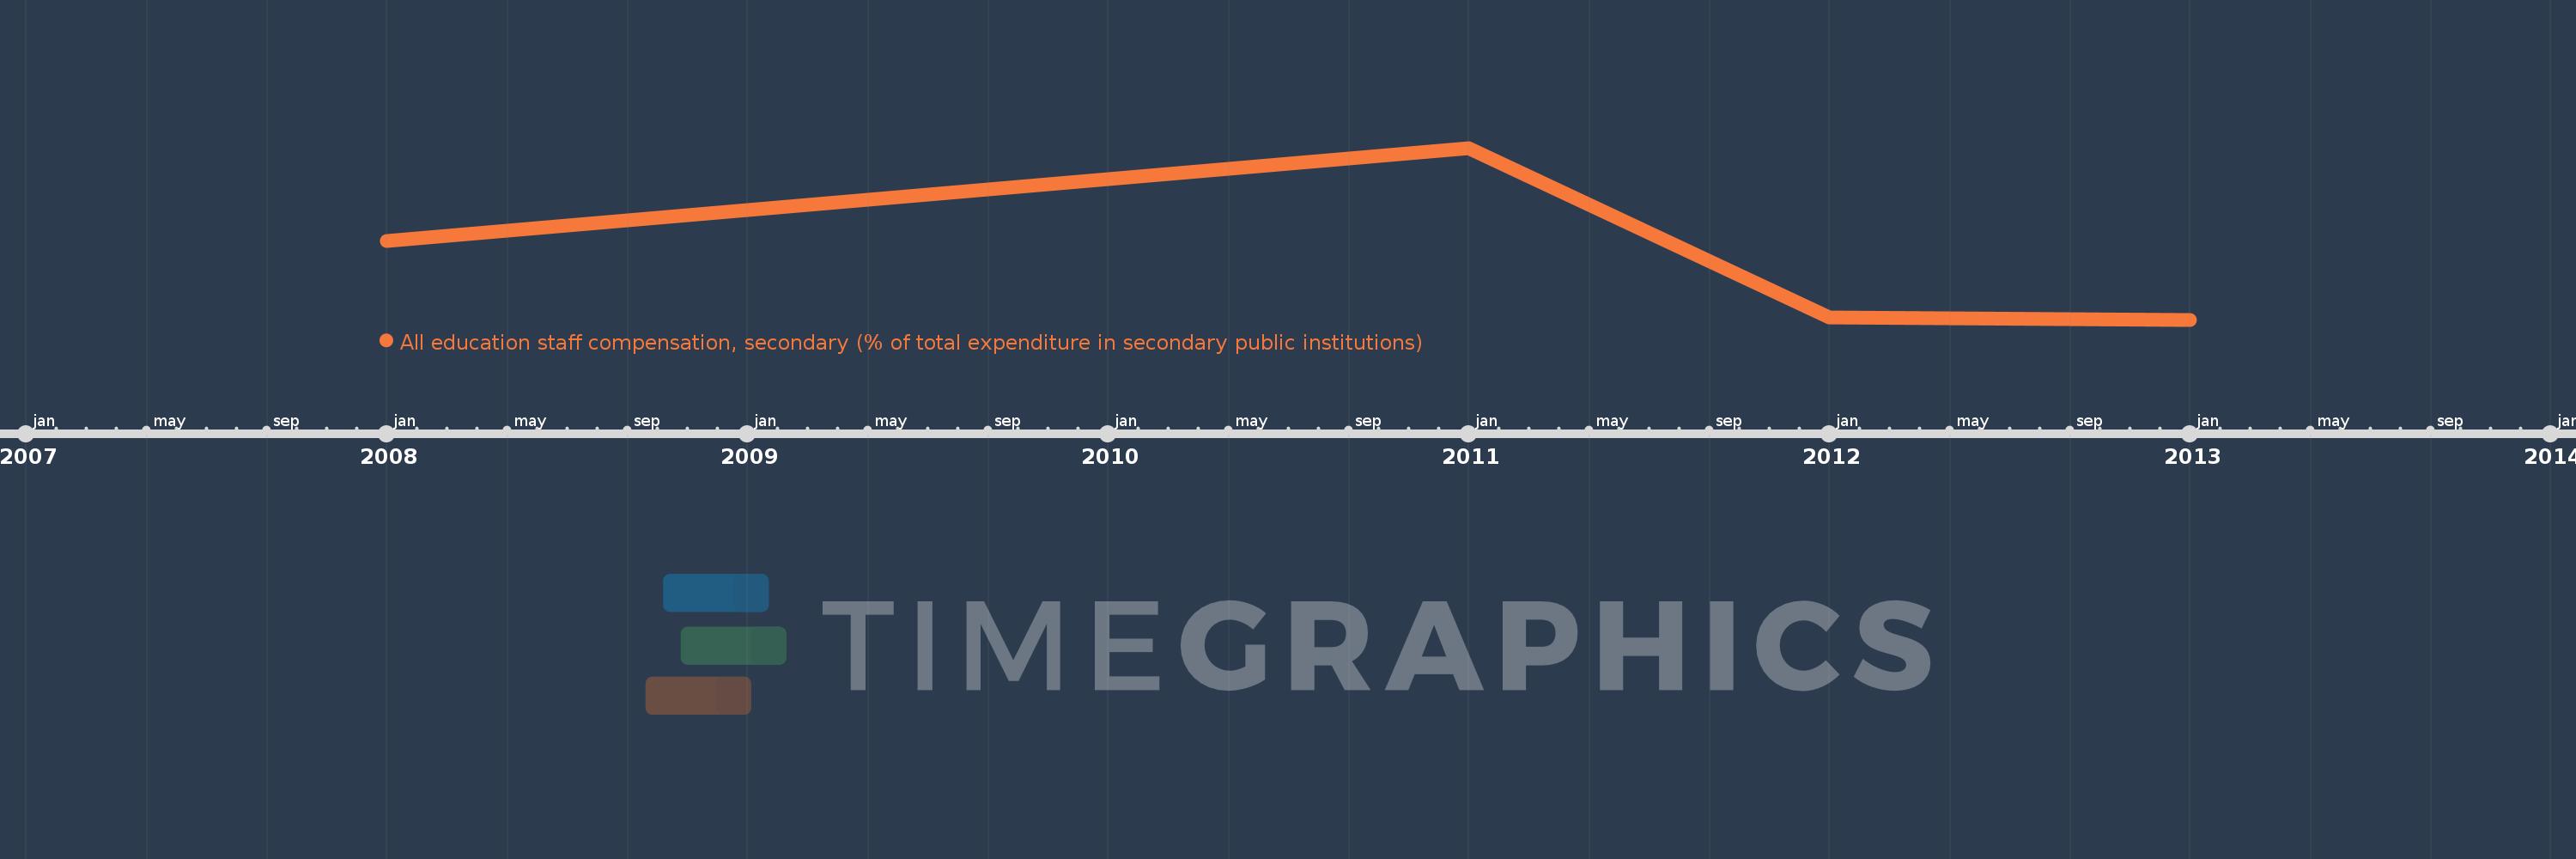
All education staff compensation, secondary (% of total expenditure in secondary public institutions)
2013,2012,2011,2008
This statistics in other country:
Timeline:
This timeline shows a graph from 2008 to 2013 of Burkina Faso. No data until 2007. Number of actual observations by date: 4.
Source name:
World Development Indicators
Source organization:
United Nations Educational, Scientific, and Cultural Organization (UNESCO) Institute for Statistics.
Categories, topics:
Education
Last updated:
apr 23, 2017
Indicators value changes by year
Minimum:
59.547
jan 1, 2013
Maximum:
77.231
jan 1, 2011
At the date of observation
Value
Absolute change
Change from previous value
jan 1, 2008
67.621
+67.621
0.0%
jan 1, 2011
77.231
+9.61
14.21%
jan 1, 2012
59.769
-17.462
-22.61%
jan 1, 2013
59.547
-0.222
-0.37%
Ranking of countries by current statistics by years


Comments: