29
/
en
AIzaSyAYiBZKx7MnpbEhh9jyipgxe19OcubqV5w
April 1, 2024
180813
Lithuania
LTU
true
2
1
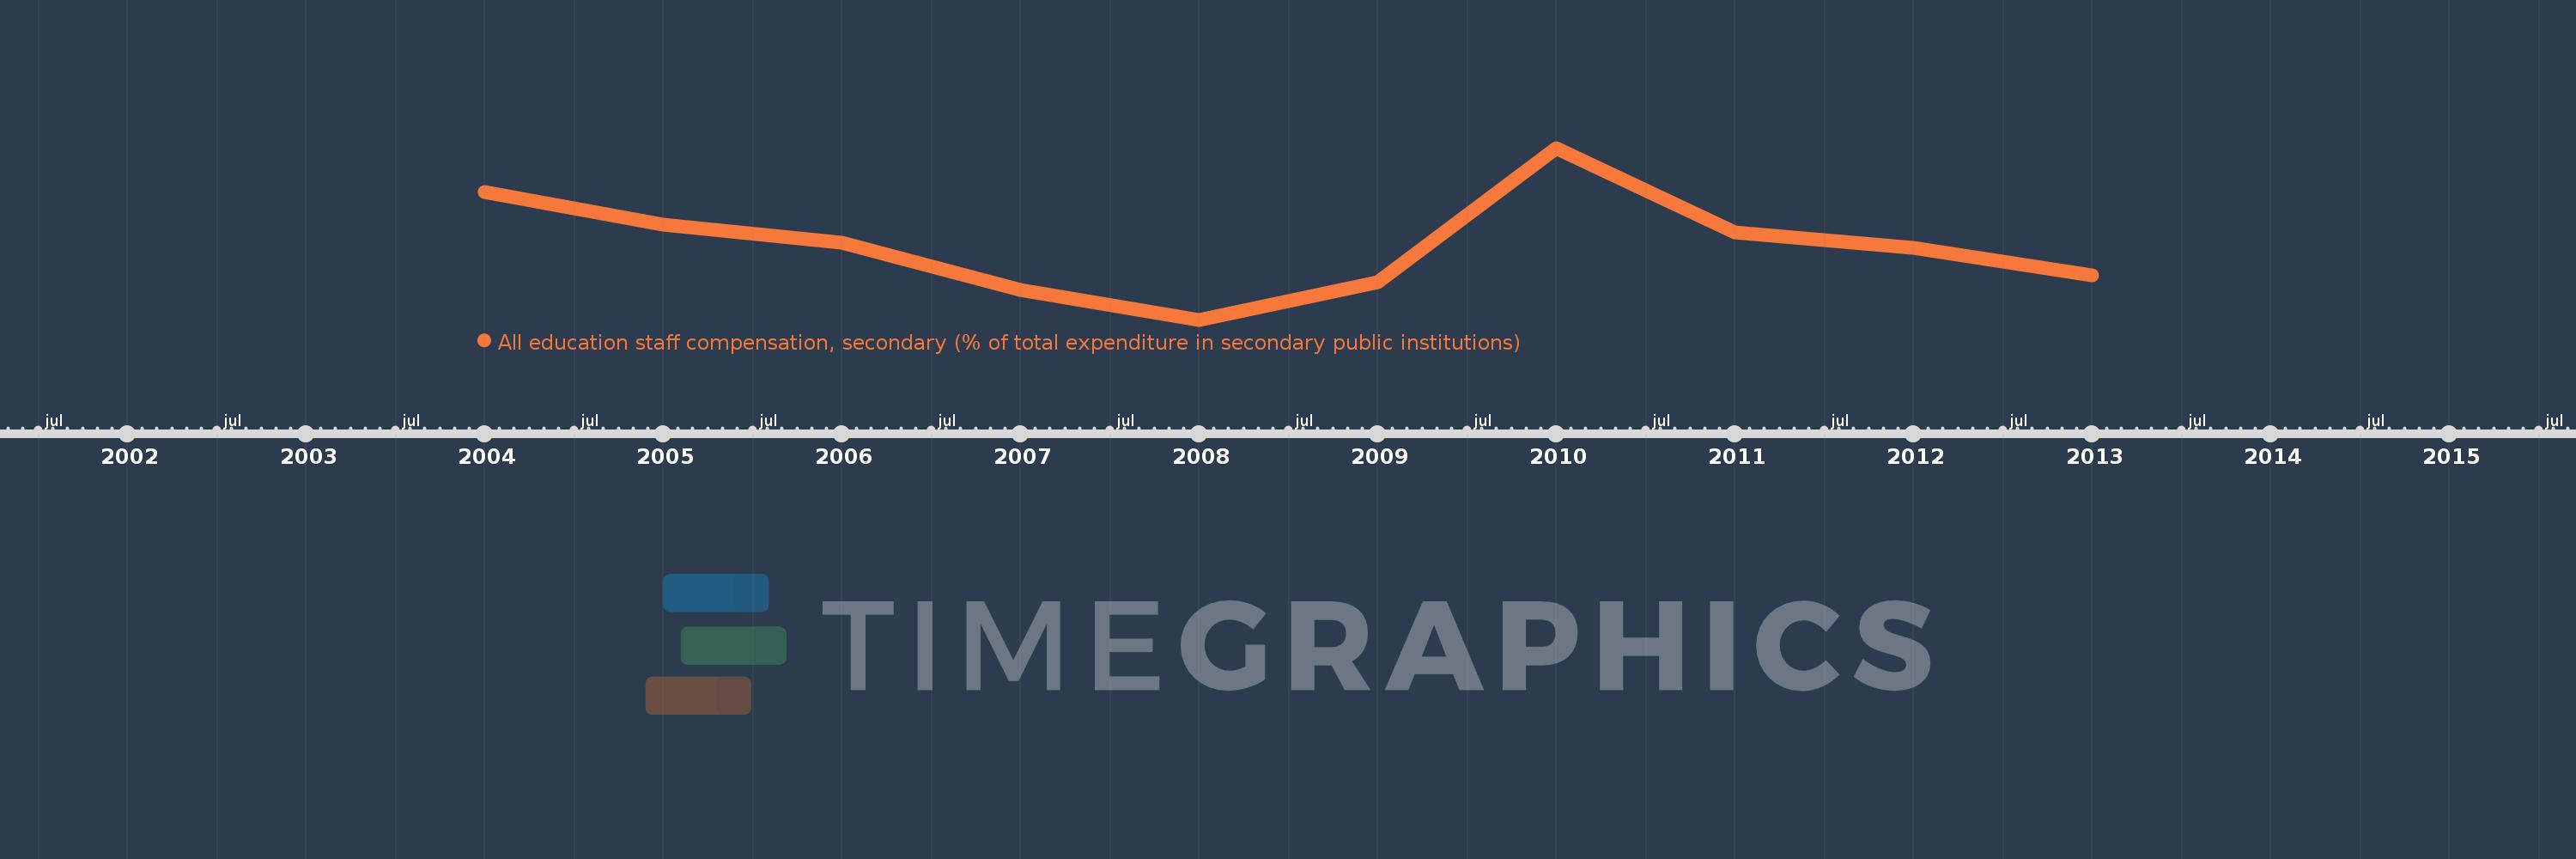
All education staff compensation, secondary (% of total expenditure in secondary public institutions)
2013,2012,2011,2010,2009,2008,2007,2006,2005,2004
This statistics in other country:
Timeline:
This timeline shows a graph from 2004 to 2013 of Lithuania. No data until 2003. Number of actual observations by date: 10.
Source name:
World Development Indicators
Source organization:
United Nations Educational, Scientific, and Cultural Organization (UNESCO) Institute for Statistics.
Categories, topics:
Education
Last updated:
apr 23, 2017
Indicators value changes by year
At the date of observation
Value
Absolute change
Change from previous value
jan 1, 2004
81.504
+81.504
0.0%
jan 1, 2005
79.208
-2.296
-2.82%
jan 1, 2006
77.993
-1.215
-1.53%
jan 1, 2007
74.714
-3.279
-4.2%
jan 1, 2008
72.64
-2.073
-2.78%
jan 1, 2009
75.25
+2.61
3.59%
jan 1, 2010
84.55
+9.3
12.36%
jan 1, 2011
78.676
-5.874
-6.95%
jan 1, 2012
77.627
-1.048
-1.33%
jan 1, 2013
75.748
-1.88
-2.42%
Ranking of countries by current statistics by years


Comments: