29
/
en
AIzaSyAYiBZKx7MnpbEhh9jyipgxe19OcubqV5w
April 1, 2024
245219
South Africa
ZAF
true
2
1
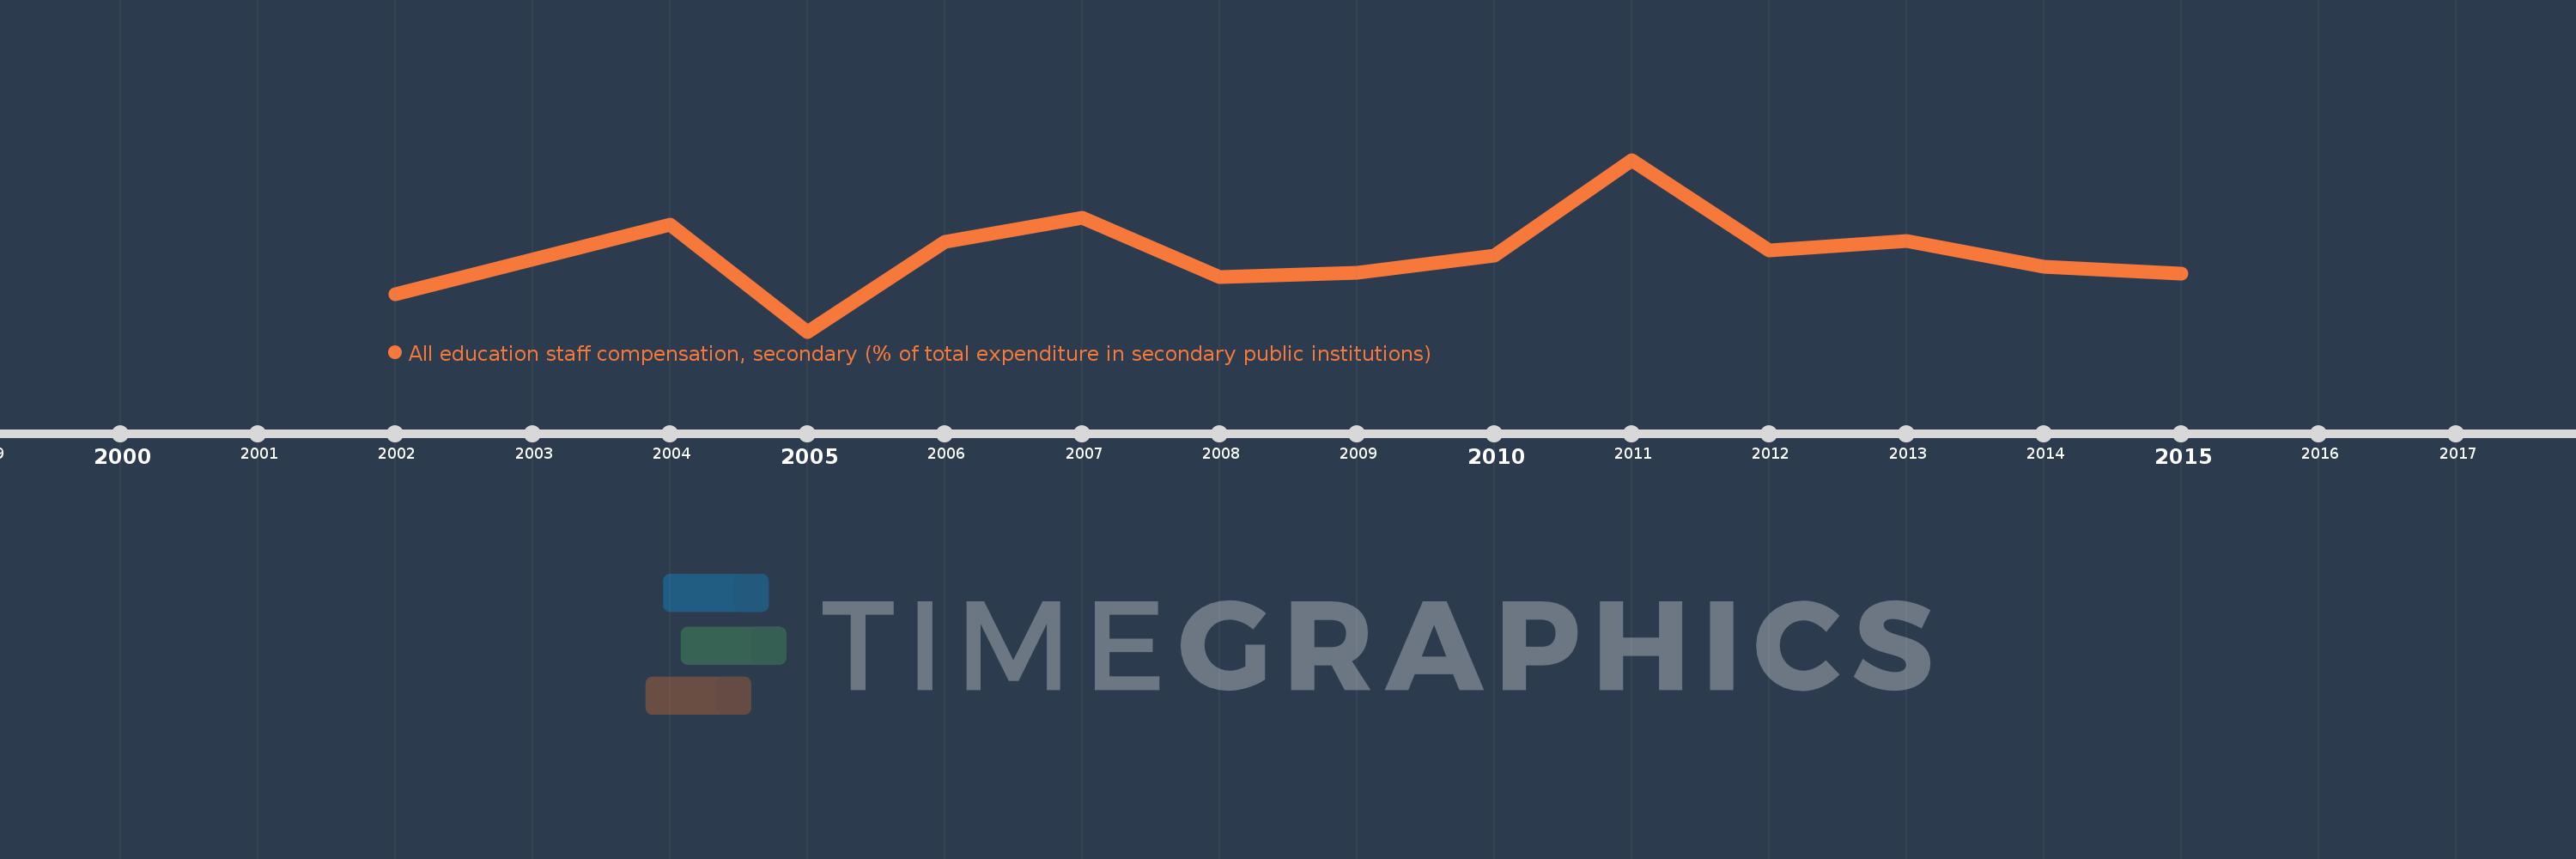
All education staff compensation, secondary (% of total expenditure in secondary public institutions)
2015,2014,2013,2012,2011,2010,2009,2008,2007,2006,2005,2004,2002
This statistics in other country:
Timeline:
This timeline shows a graph from 2002 to 2015 of South Africa. No data until 2001. Number of actual observations by date: 13.
Source name:
World Development Indicators
Source organization:
United Nations Educational, Scientific, and Cultural Organization (UNESCO) Institute for Statistics.
Categories, topics:
Education
Last updated:
apr 23, 2017
Indicators value changes by year
Minimum:
77.519
jan 1, 2005
At the date of observation
Value
Absolute change
Change from previous value
jan 1, 2002
82.458
+82.458
0.0%
jan 1, 2004
91.482
+9.023
10.94%
jan 1, 2005
77.519
-13.963
-15.26%
jan 1, 2006
89.248
+11.729
15.13%
jan 1, 2007
92.467
+3.22
3.61%
jan 1, 2008
84.679
-7.788
-8.42%
jan 1, 2009
85.251
+0.572
0.68%
jan 1, 2010
87.474
+2.223
2.61%
jan 1, 2011
100.0
+12.526
14.32%
jan 1, 2012
88.137
-11.863
-11.86%
jan 1, 2013
89.372
+1.236
1.4%
jan 1, 2014
85.984
-3.389
-3.79%
jan 1, 2015
85.063
-0.921
-1.07%
Ranking of countries by current statistics by years


Comments: