29
/
en
AIzaSyAYiBZKx7MnpbEhh9jyipgxe19OcubqV5w
April 1, 2024
224559
Poland
POL
true
2
1
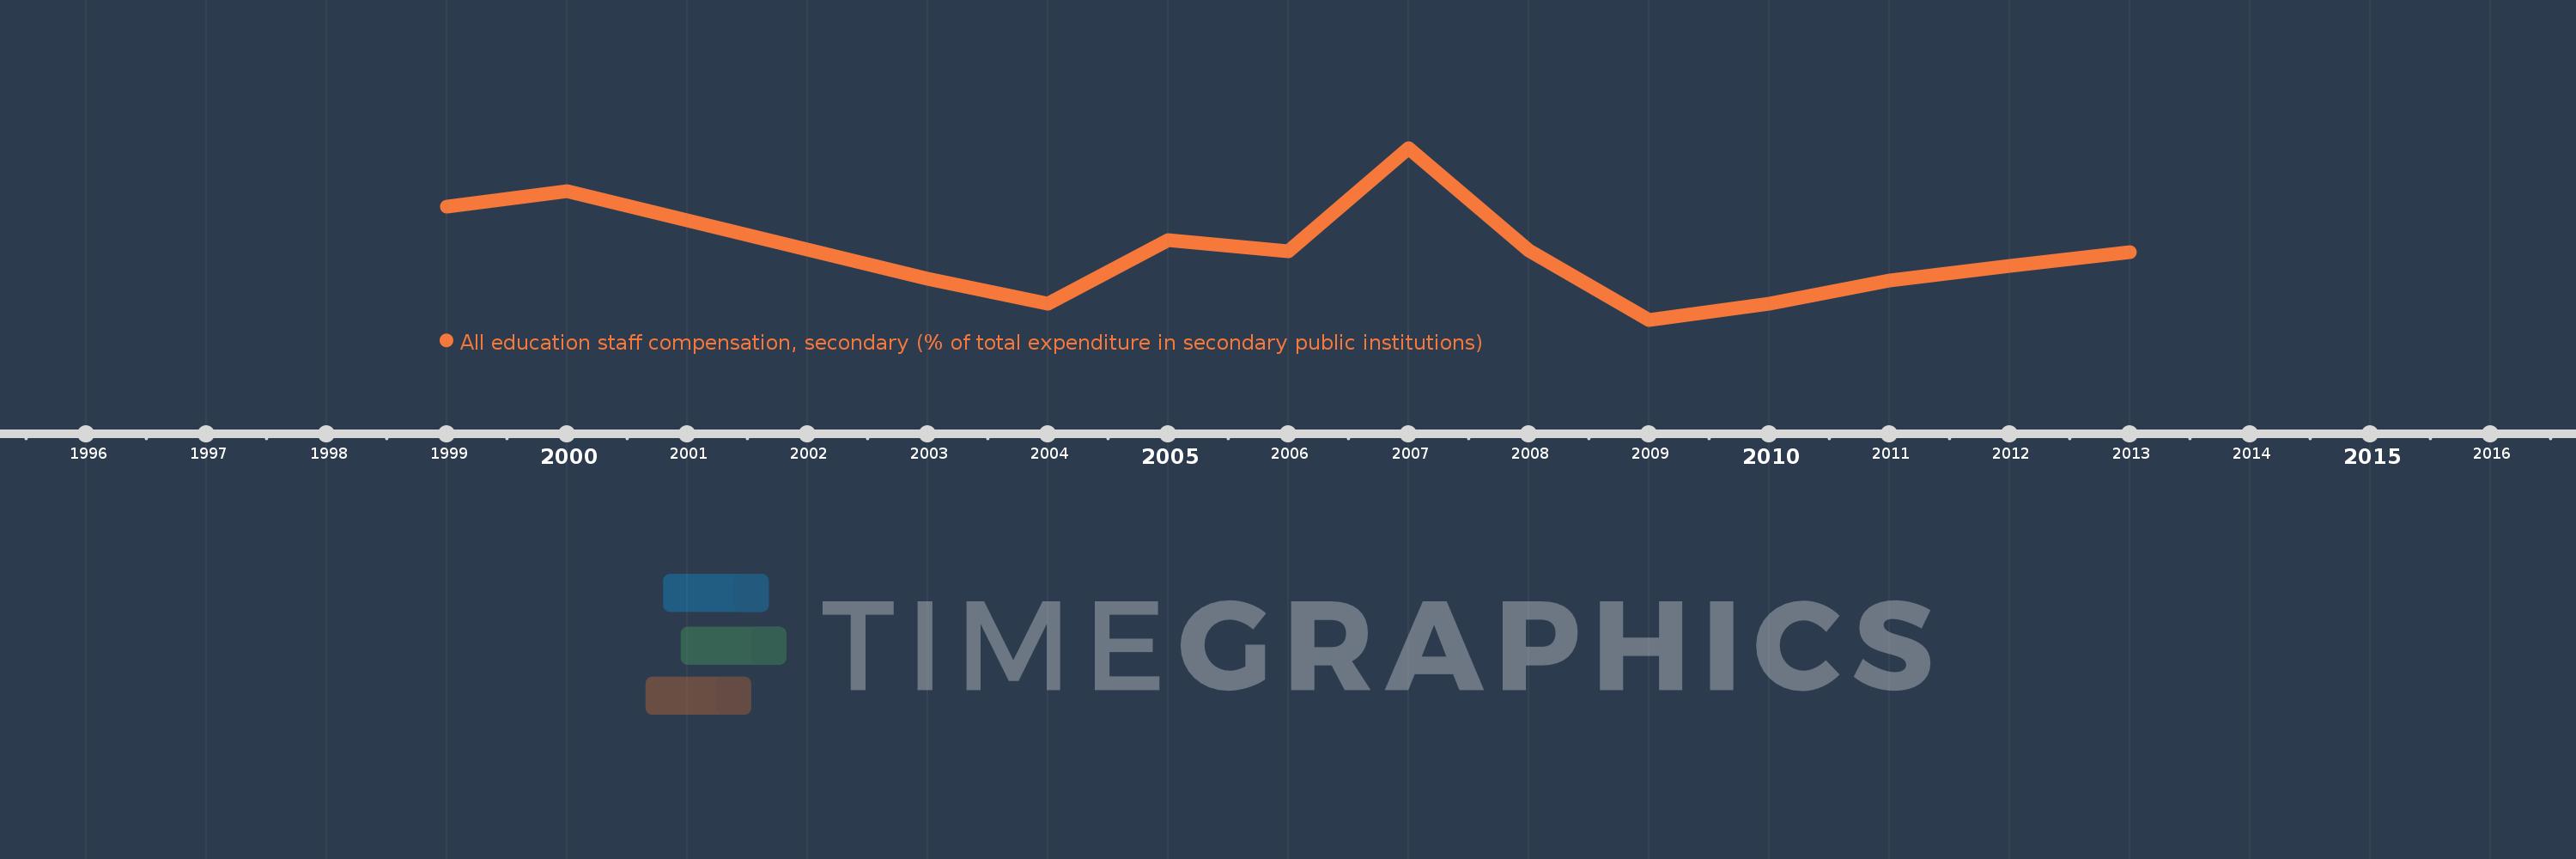
All education staff compensation, secondary (% of total expenditure in secondary public institutions)
2013,2012,2011,2010,2009,2008,2007,2006,2005,2004,2003,2000,1999
This statistics in other country:
Timeline:
This timeline shows a graph from 1999 to 2013 of Poland. No data until 1998. Number of actual observations by date: 13.
Source name:
World Development Indicators
Source organization:
United Nations Educational, Scientific, and Cultural Organization (UNESCO) Institute for Statistics.
Categories, topics:
Education
Last updated:
apr 23, 2017
Indicators value changes by year
Minimum:
61.451
jan 1, 2009
Maximum:
74.791
jan 1, 2007
At the date of observation
Value
Absolute change
Change from previous value
jan 1, 1999
70.206
+70.206
0.0%
jan 1, 2000
71.42
+1.214
1.73%
jan 1, 2003
64.608
-6.812
-9.54%
jan 1, 2004
62.716
-1.891
-2.93%
jan 1, 2005
67.655
+4.938
7.87%
jan 1, 2006
66.766
-0.889
-1.31%
jan 1, 2007
74.791
+8.025
12.02%
jan 1, 2008
66.853
-7.937
-10.61%
jan 1, 2009
61.451
-5.402
-8.08%
jan 1, 2010
62.686
+1.235
2.01%
jan 1, 2011
64.518
+1.832
2.92%
jan 1, 2012
65.659
+1.141
1.77%
jan 1, 2013
66.723
+1.064
1.62%
Ranking of countries by current statistics by years


Comments: