29
/
en
AIzaSyAYiBZKx7MnpbEhh9jyipgxe19OcubqV5w
April 1, 2024
139989
Ghana
GHA
true
2
1
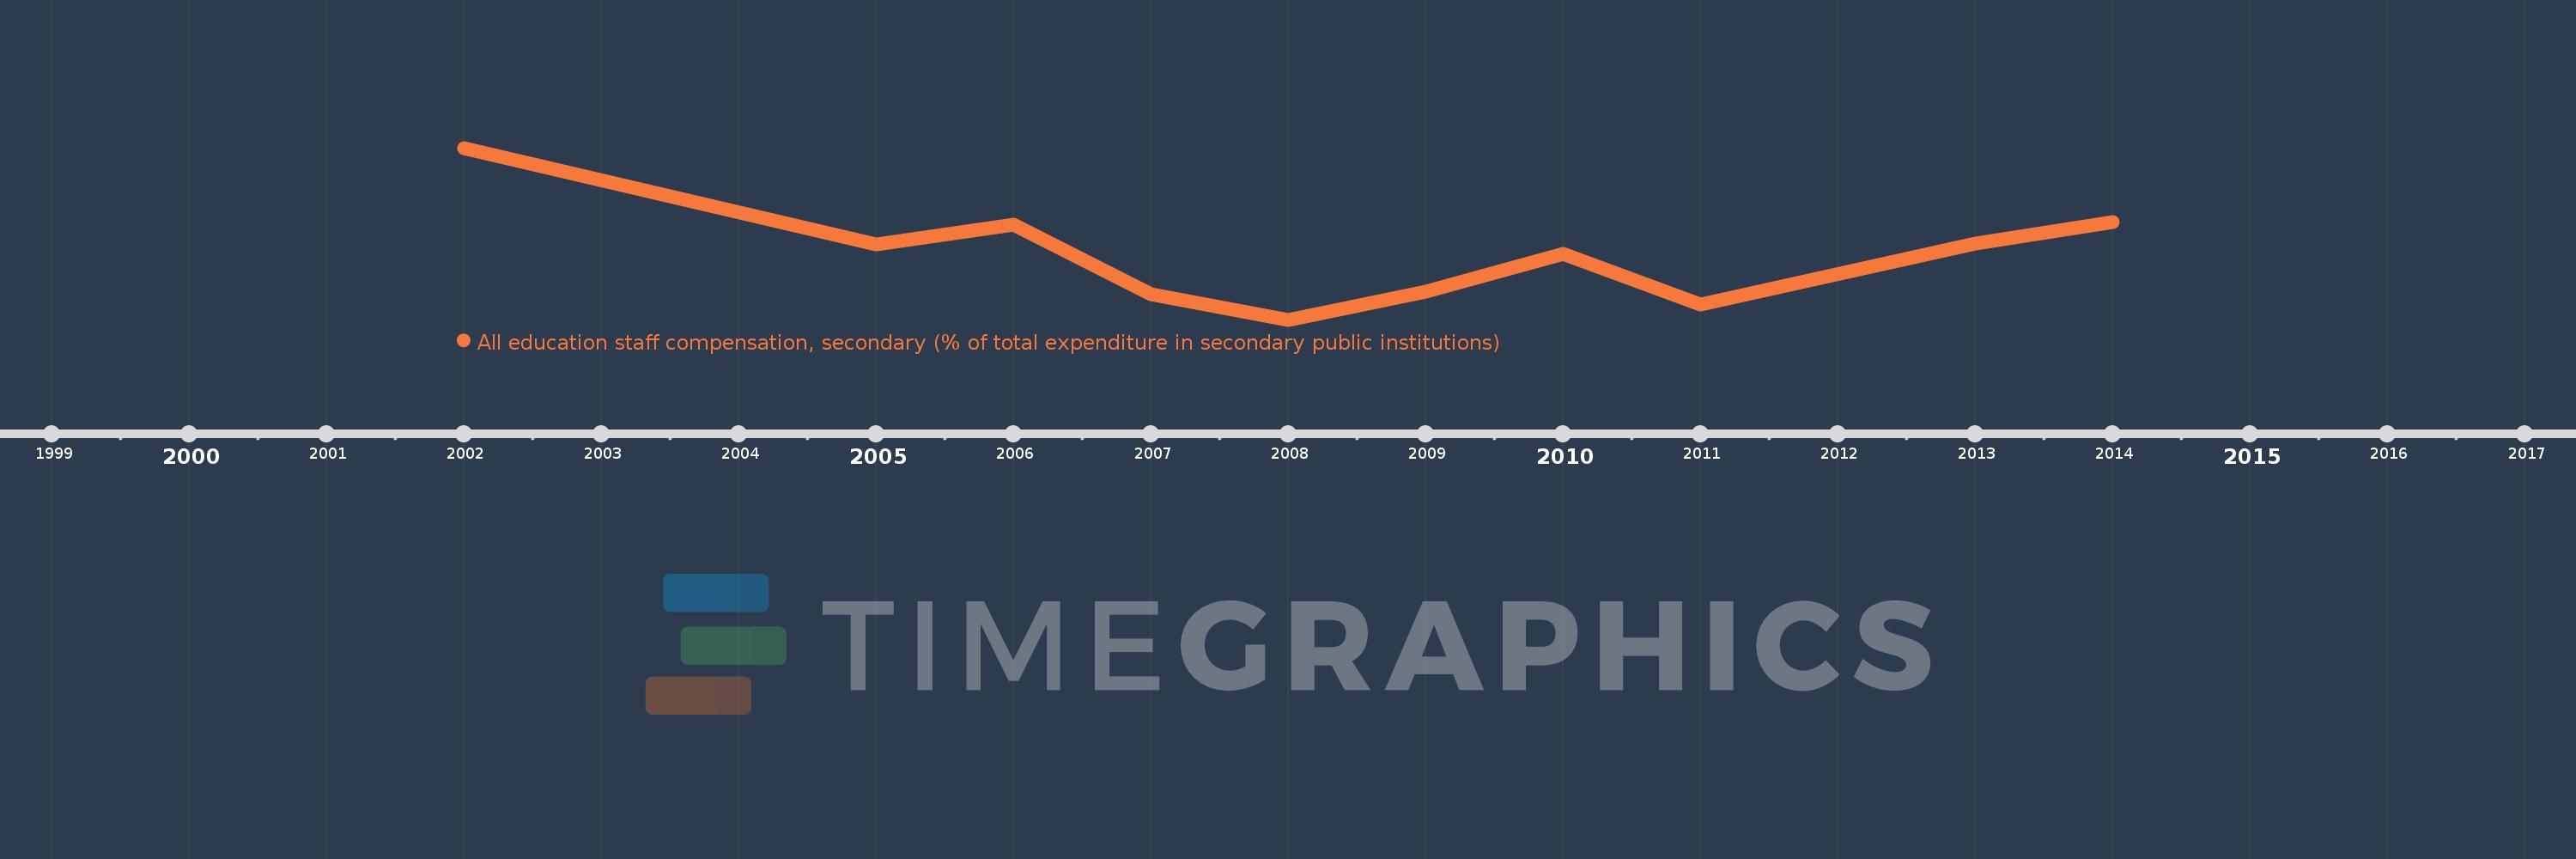
All education staff compensation, secondary (% of total expenditure in secondary public institutions)
2014,2013,2011,2010,2009,2008,2007,2006,2005,2002
This statistics in other country:
Timeline:
This timeline shows a graph from 2002 to 2014 of Ghana. No data until 2001. Number of actual observations by date: 10.
Source name:
World Development Indicators
Source organization:
United Nations Educational, Scientific, and Cultural Organization (UNESCO) Institute for Statistics.
Categories, topics:
Education
Last updated:
apr 23, 2017
Indicators value changes by year
Minimum:
54.187
jan 1, 2008
Maximum:
96.916
jan 1, 2002
At the date of observation
Value
Absolute change
Change from previous value
jan 1, 2002
96.916
+96.916
0.0%
jan 1, 2005
72.904
-24.012
-24.78%
jan 1, 2006
77.775
+4.872
6.68%
jan 1, 2007
60.627
-17.148
-22.05%
jan 1, 2008
54.187
-6.44
-10.62%
jan 1, 2009
61.187
+6.999
12.92%
jan 1, 2010
70.551
+9.364
15.3%
jan 1, 2011
57.998
-12.553
-17.79%
jan 1, 2013
73.092
+15.095
26.03%
jan 1, 2014
78.397
+5.305
7.26%
Ranking of countries by current statistics by years


Comments: