29
/
en
AIzaSyAYiBZKx7MnpbEhh9jyipgxe19OcubqV5w
April 1, 2024
257045
Switzerland
CHE
true
2
1
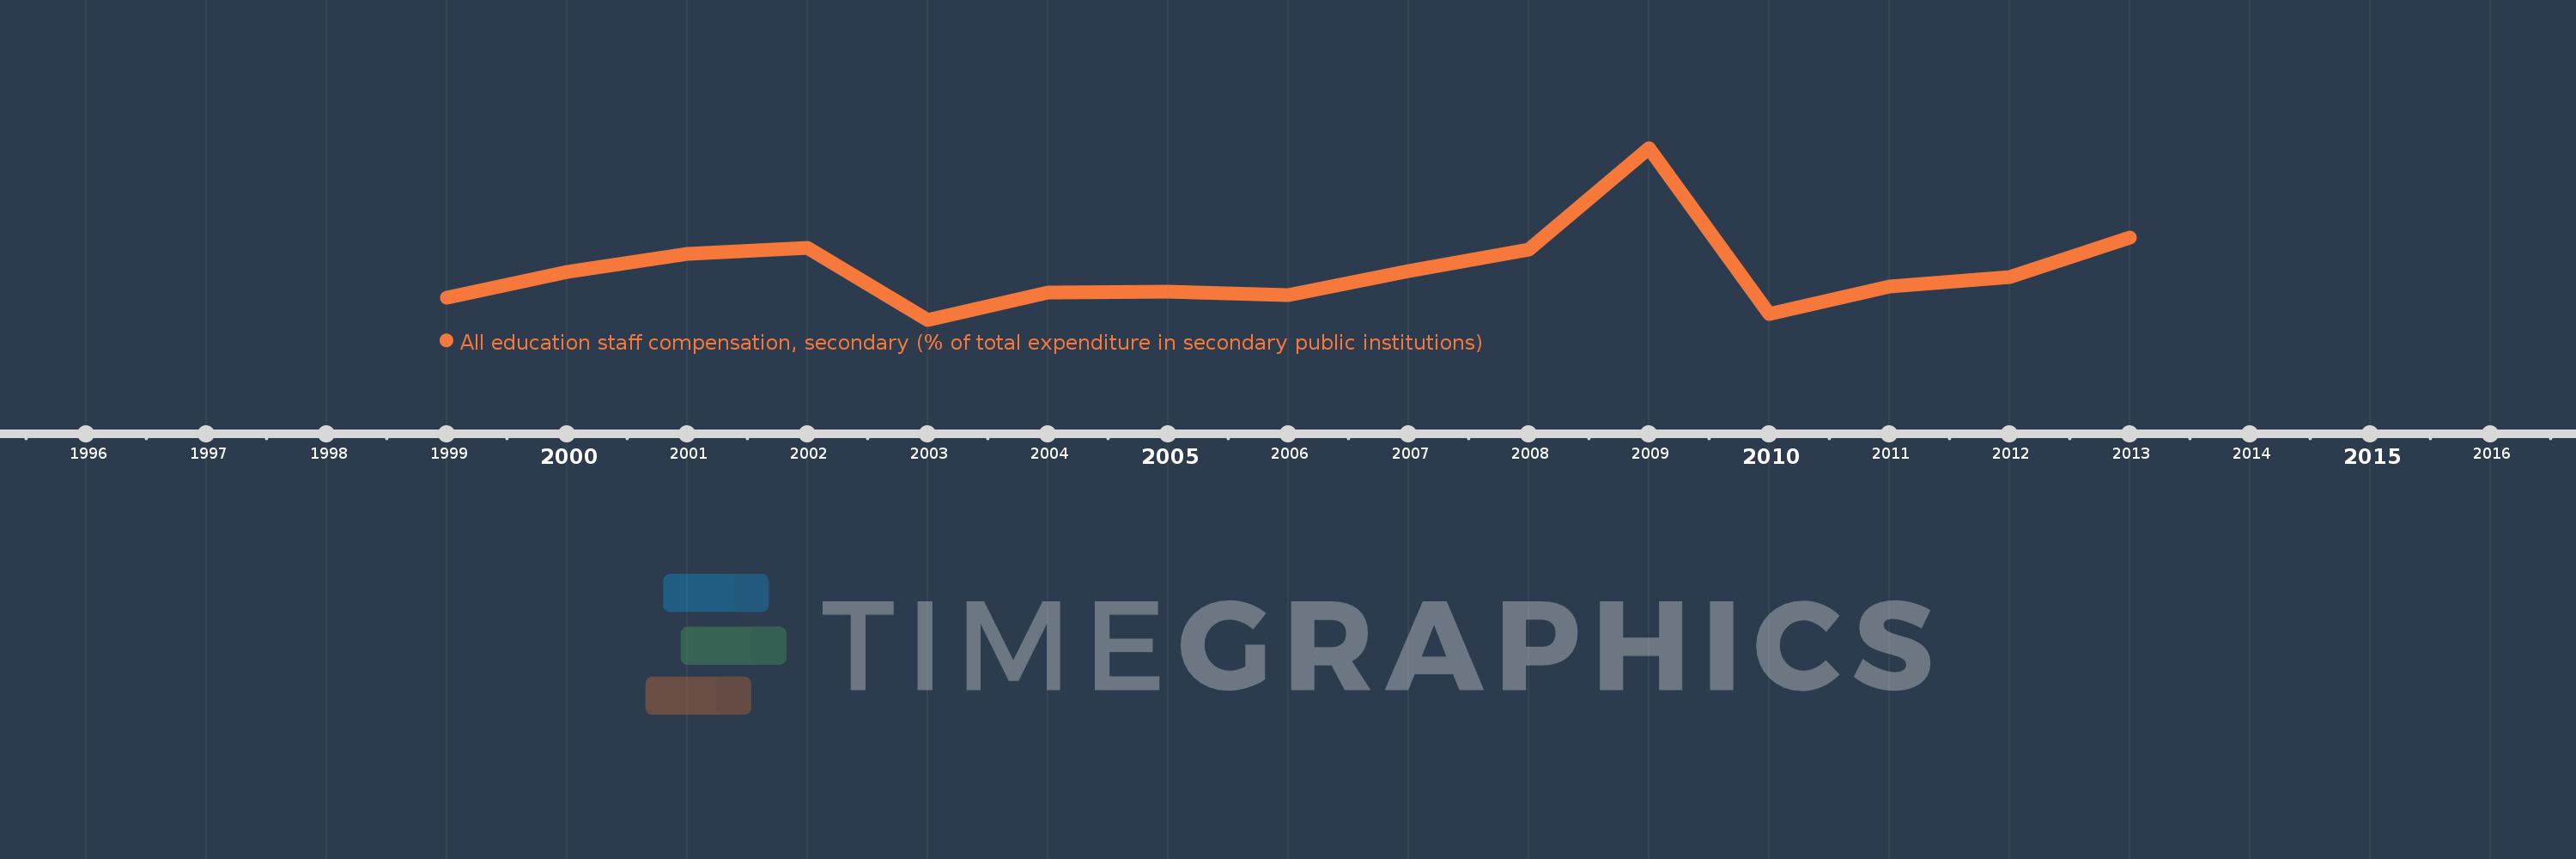
All education staff compensation, secondary (% of total expenditure in secondary public institutions)
2013,2012,2011,2010,2009,2008,2007,2006,2005,2004,2003,2002,2001,2000,1999
This statistics in other country:
Timeline:
This timeline shows a graph from 1999 to 2013 of Switzerland. No data until 1998. Number of actual observations by date: 15.
Source name:
World Development Indicators
Source organization:
United Nations Educational, Scientific, and Cultural Organization (UNESCO) Institute for Statistics.
Categories, topics:
Education
Last updated:
apr 23, 2017
Indicators value changes by year
Minimum:
77.644
jan 1, 2003
Maximum:
80.643
jan 1, 2009
At the date of observation
Value
Absolute change
Change from previous value
jan 1, 1999
78.024
+78.024
0.0%
jan 1, 2000
78.485
+0.461
0.59%
jan 1, 2001
78.801
+0.316
0.4%
jan 1, 2002
78.896
+0.095
0.12%
jan 1, 2003
77.644
-1.252
-1.59%
jan 1, 2004
78.115
+0.472
0.61%
jan 1, 2005
78.128
+0.012
0.02%
jan 1, 2006
78.072
-0.056
-0.07%
jan 1, 2007
78.498
+0.426
0.55%
jan 1, 2008
78.866
+0.368
0.47%
jan 1, 2009
80.643
+1.777
2.25%
jan 1, 2010
77.738
-2.905
-3.6%
jan 1, 2011
78.218
+0.48
0.62%
jan 1, 2012
78.382
+0.164
0.21%
jan 1, 2013
79.074
+0.692
0.88%
Ranking of countries by current statistics by years


Comments: