29
/
en
AIzaSyAYiBZKx7MnpbEhh9jyipgxe19OcubqV5w
April 1, 2024
250488
St. Lucia
LCA
true
2
1
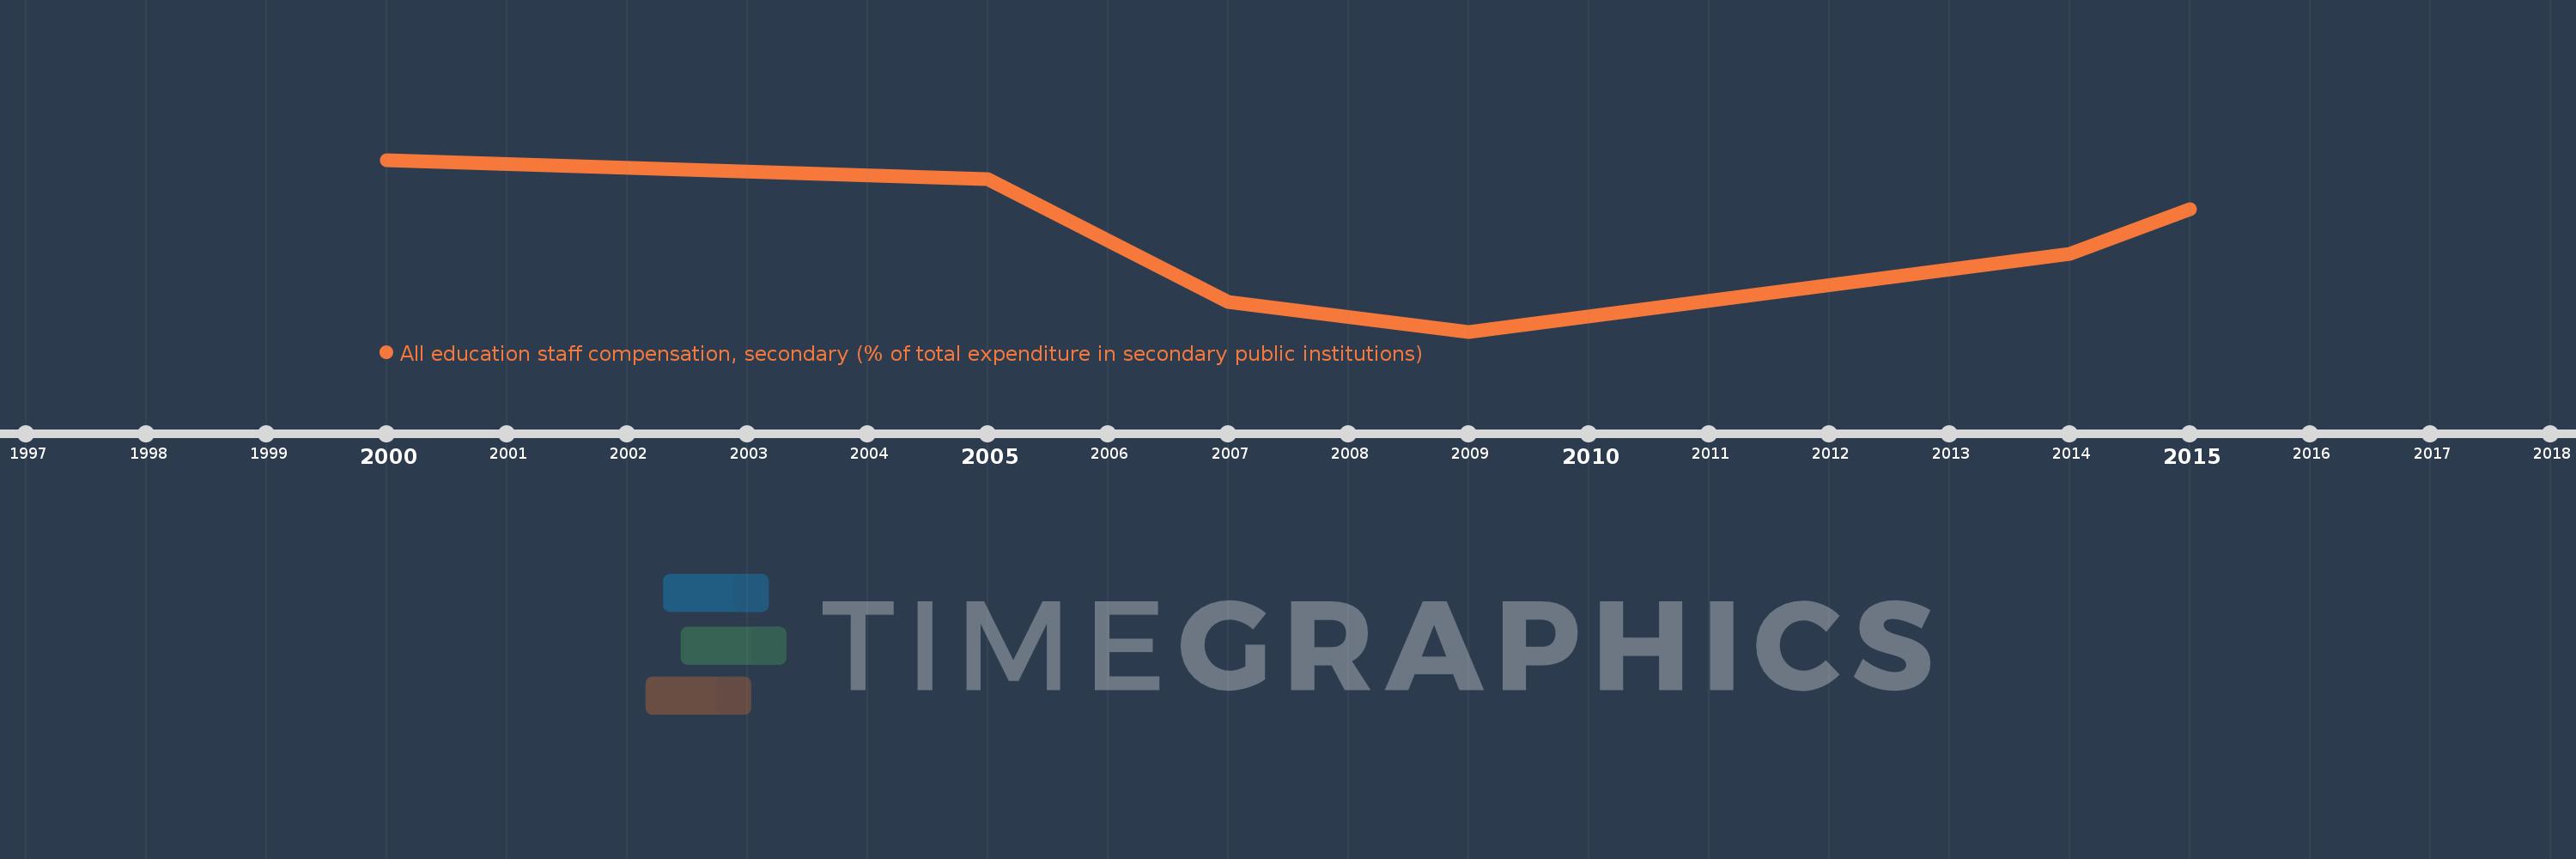
All education staff compensation, secondary (% of total expenditure in secondary public institutions)
2015,2014,2009,2007,2005,2000
This statistics in other country:
Timeline:
This timeline shows a graph from 2000 to 2015 of St. Lucia. No data until 1999. Number of actual observations by date: 6.
Source name:
World Development Indicators
Source organization:
United Nations Educational, Scientific, and Cultural Organization (UNESCO) Institute for Statistics.
Categories, topics:
Education
Last updated:
apr 23, 2017
Indicators value changes by year
Minimum:
57.264
jan 1, 2009
Maximum:
94.267
jan 1, 2000
At the date of observation
Value
Absolute change
Change from previous value
jan 1, 2000
94.267
+94.267
0.0%
jan 1, 2005
90.105
-4.163
-4.42%
jan 1, 2007
63.644
-26.46
-29.37%
jan 1, 2009
57.264
-6.381
-10.03%
jan 1, 2014
74.066
+16.802
29.34%
jan 1, 2015
83.699
+9.633
13.01%
Ranking of countries by current statistics by years


Comments: