29
/
en
AIzaSyAYiBZKx7MnpbEhh9jyipgxe19OcubqV5w
April 1, 2024
207679
Netherlands
NLD
true
2
1
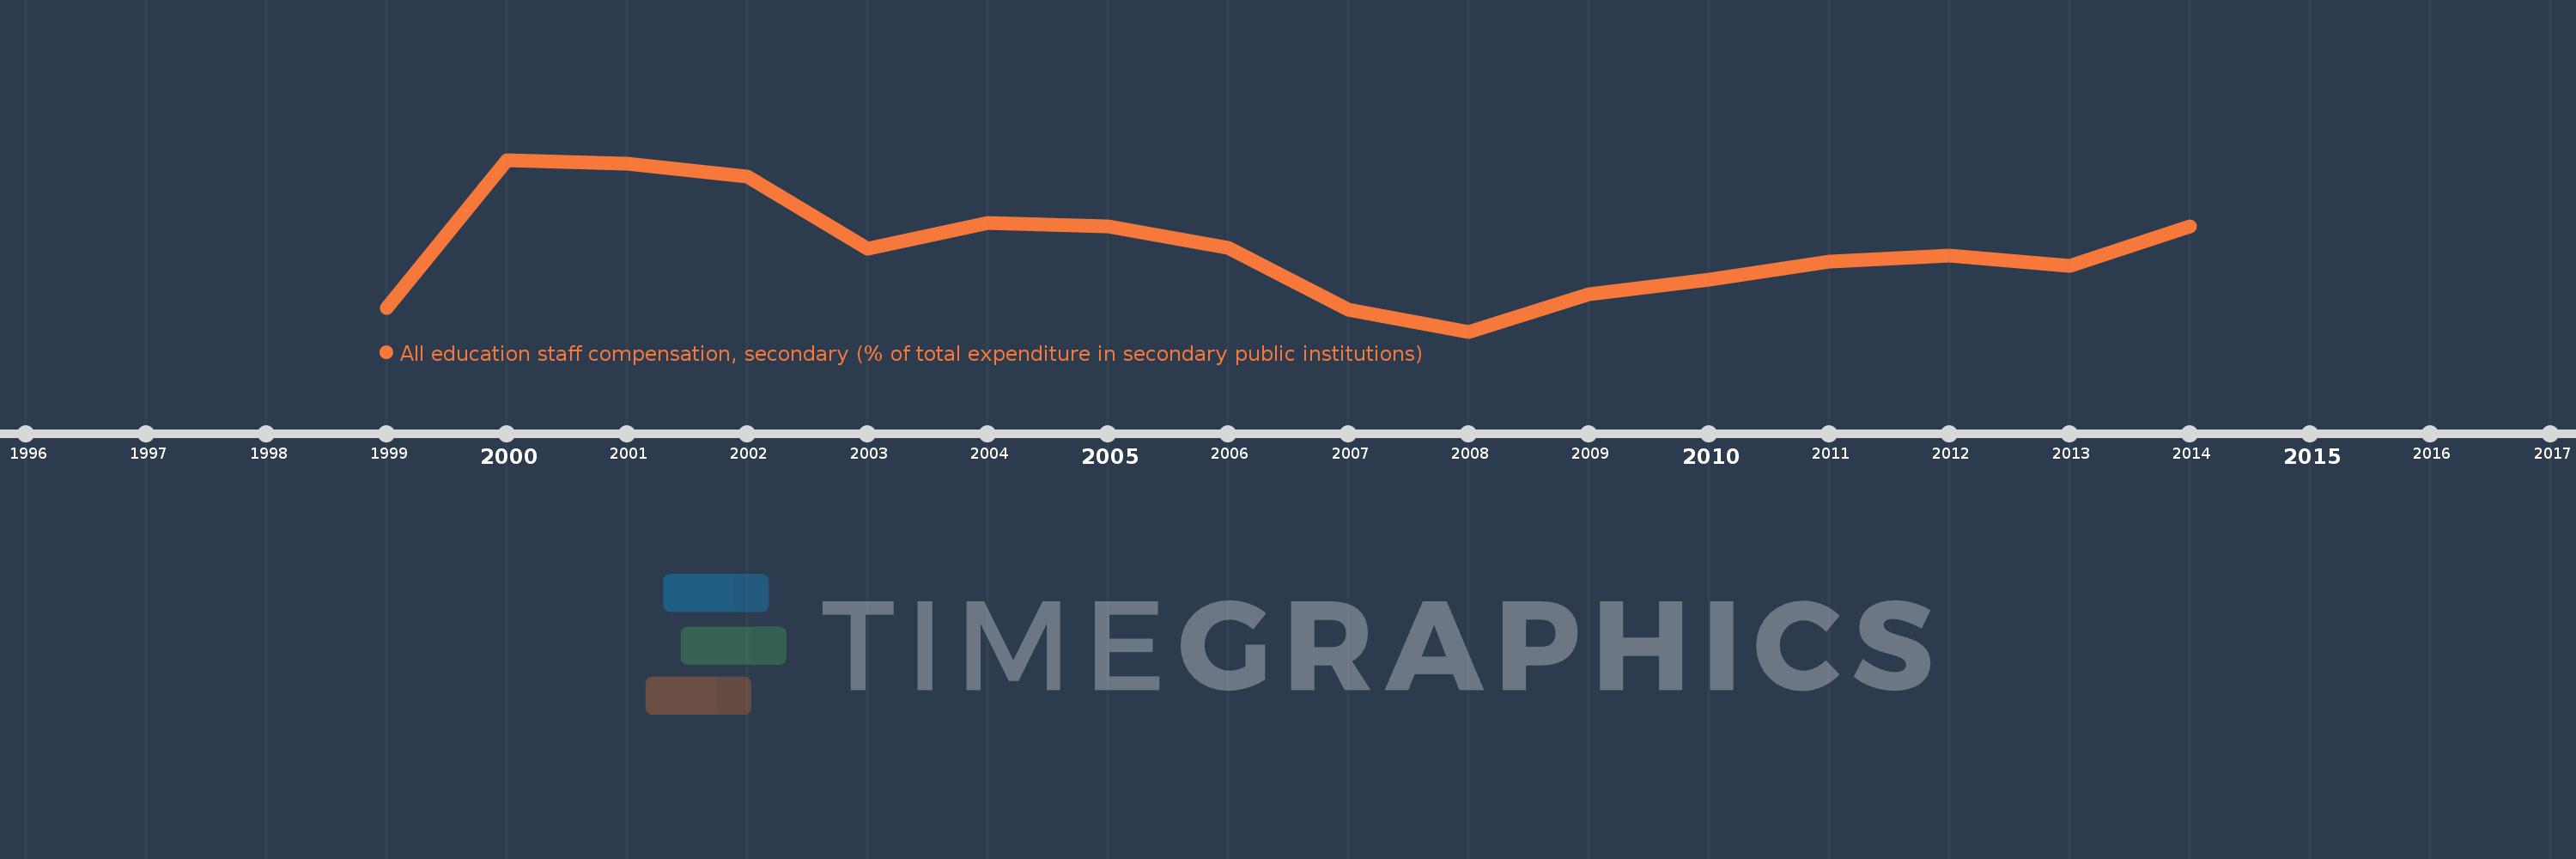
All education staff compensation, secondary (% of total expenditure in secondary public institutions)
2014,2013,2012,2011,2010,2009,2008,2007,2006,2005,2004,2003,2002,2001,2000,1999
This statistics in other country:
Timeline:
This timeline shows a graph from 1999 to 2014 of Netherlands. No data until 1998. Number of actual observations by date: 16.
Source name:
World Development Indicators
Source organization:
United Nations Educational, Scientific, and Cultural Organization (UNESCO) Institute for Statistics.
Categories, topics:
Education
Last updated:
apr 23, 2017
Indicators value changes by year
Minimum:
67.266
jan 1, 2008
Maximum:
73.688
jan 1, 2000
At the date of observation
Value
Absolute change
Change from previous value
jan 1, 1999
68.149
+68.149
0.0%
jan 1, 2000
73.688
+5.54
8.13%
jan 1, 2001
73.553
-0.135
-0.18%
jan 1, 2002
73.069
-0.484
-0.66%
jan 1, 2003
70.38
-2.689
-3.68%
jan 1, 2004
71.332
+0.952
1.35%
jan 1, 2005
71.187
-0.145
-0.2%
jan 1, 2006
70.395
-0.792
-1.11%
jan 1, 2007
68.075
-2.32
-3.3%
jan 1, 2008
67.266
-0.809
-1.19%
jan 1, 2009
68.655
+1.389
2.06%
jan 1, 2010
69.217
+0.562
0.82%
jan 1, 2011
69.878
+0.661
0.95%
jan 1, 2012
70.114
+0.236
0.34%
jan 1, 2013
69.718
-0.396
-0.56%
jan 1, 2014
71.213
+1.495
2.14%
Ranking of countries by current statistics by years


Comments: