29
/
en
AIzaSyAYiBZKx7MnpbEhh9jyipgxe19OcubqV5w
April 1, 2024
90766
Brazil
BRA
true
2
1
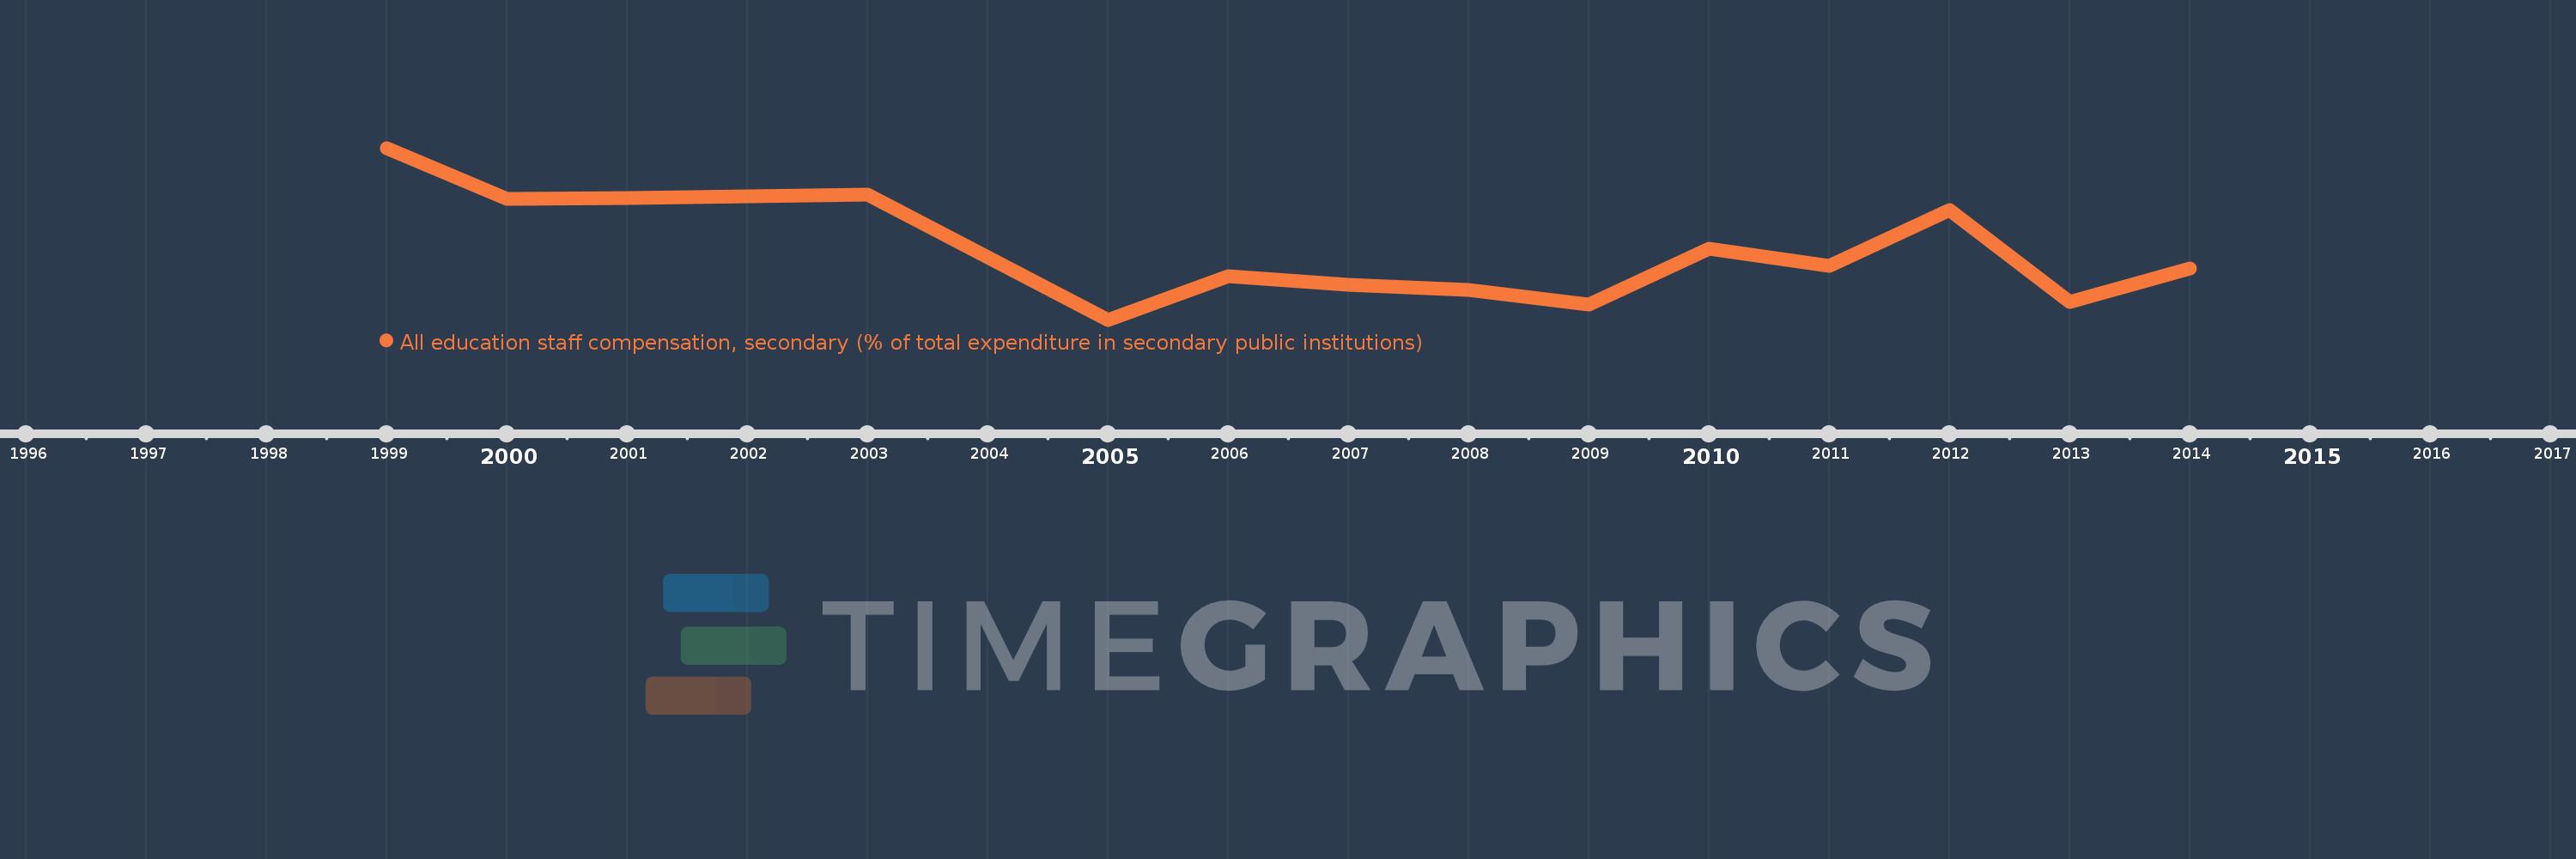
All education staff compensation, secondary (% of total expenditure in secondary public institutions)
2014,2013,2012,2011,2010,2009,2008,2007,2006,2005,2003,2002,2001,2000,1999
This statistics in other country:
Timeline:
This timeline shows a graph from 1999 to 2014 of Brazil. No data until 1998. Number of actual observations by date: 15.
Source name:
World Development Indicators
Source organization:
United Nations Educational, Scientific, and Cultural Organization (UNESCO) Institute for Statistics.
Categories, topics:
Education
Last updated:
apr 23, 2017
Indicators value changes by year
Minimum:
66.608
jan 1, 2005
Maximum:
80.041
jan 1, 1999
At the date of observation
Value
Absolute change
Change from previous value
jan 1, 1999
80.041
+80.041
0.0%
jan 1, 2000
76.068
-3.973
-4.96%
jan 1, 2001
76.143
+0.075
0.1%
jan 1, 2002
76.271
+0.127
0.17%
jan 1, 2003
76.409
+0.138
0.18%
jan 1, 2005
66.608
-9.801
-12.83%
jan 1, 2006
69.98
+3.372
5.06%
jan 1, 2007
69.327
-0.654
-0.93%
jan 1, 2008
68.959
-0.367
-0.53%
jan 1, 2009
67.814
-1.146
-1.66%
jan 1, 2010
72.142
+4.328
6.38%
jan 1, 2011
70.809
-1.332
-1.85%
jan 1, 2012
75.19
+4.381
6.19%
jan 1, 2013
67.983
-7.208
-9.59%
jan 1, 2014
70.634
+2.651
3.9%
Ranking of countries by current statistics by years


Comments: