29
/
en
AIzaSyAYiBZKx7MnpbEhh9jyipgxe19OcubqV5w
April 1, 2024
198472
Monaco
MCO
true
2
1
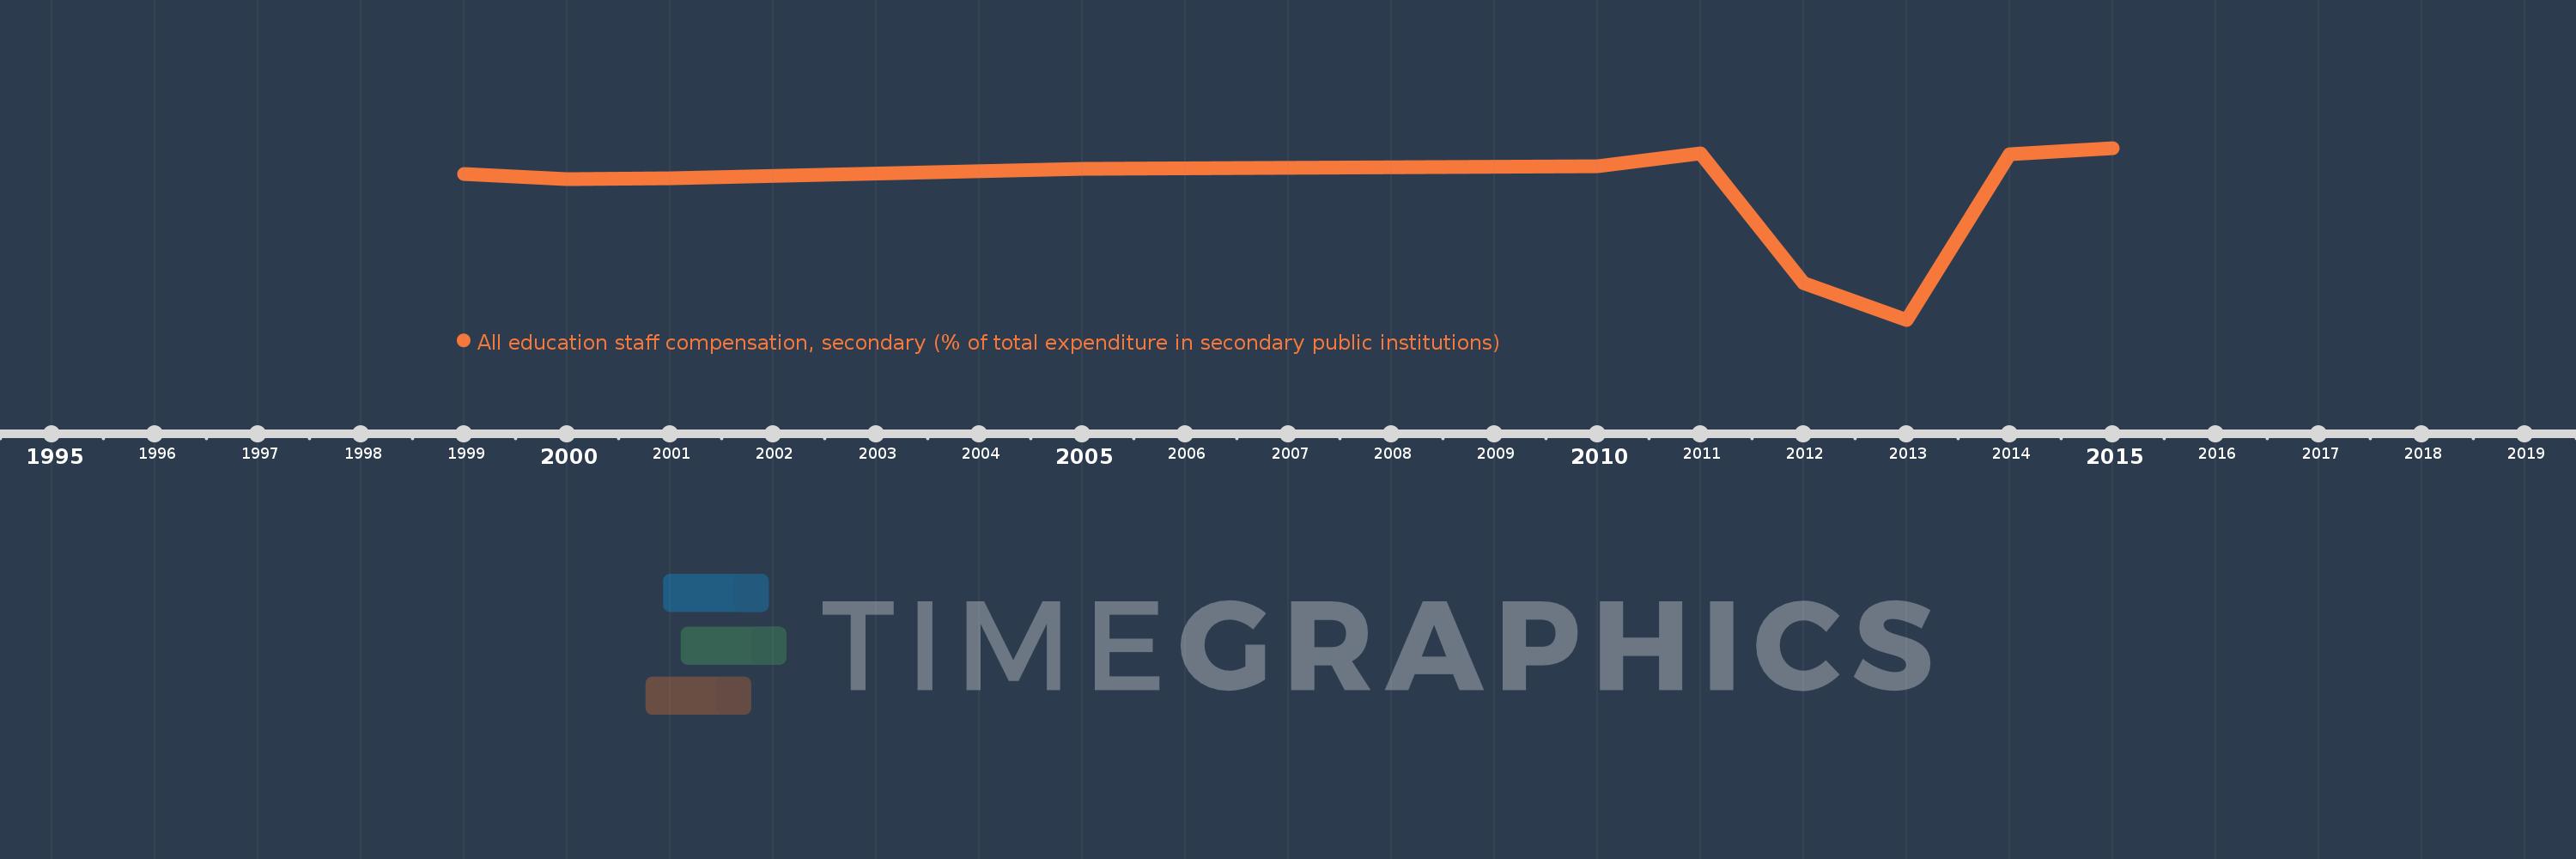
All education staff compensation, secondary (% of total expenditure in secondary public institutions)
2015,2014,2013,2012,2011,2010,2005,2001,2000,1999
This statistics in other country:
Timeline:
This timeline shows a graph from 1999 to 2015 of Monaco. No data until 1998. Number of actual observations by date: 10.
Source name:
World Development Indicators
Source organization:
United Nations Educational, Scientific, and Cultural Organization (UNESCO) Institute for Statistics.
Categories, topics:
Education
Last updated:
apr 23, 2017
Indicators value changes by year
Maximum:
95.705
jan 1, 2015
At the date of observation
Value
Absolute change
Change from previous value
jan 1, 1999
87.701
+87.701
0.0%
jan 1, 2000
86.335
-1.365
-1.56%
jan 1, 2001
86.616
+0.281
0.33%
jan 1, 2005
89.309
+2.693
3.11%
jan 1, 2010
90.089
+0.78
0.87%
jan 1, 2011
94.17
+4.081
4.53%
jan 1, 2012
54.656
-39.514
-41.96%
jan 1, 2013
43.63
-11.027
-20.17%
jan 1, 2014
93.7
+50.071
114.76%
jan 1, 2015
95.705
+2.005
2.14%
Ranking of countries by current statistics by years


Comments: