29
/
en
AIzaSyAYiBZKx7MnpbEhh9jyipgxe19OcubqV5w
April 1, 2024
121749
Dominican Republic
DOM
true
2
1
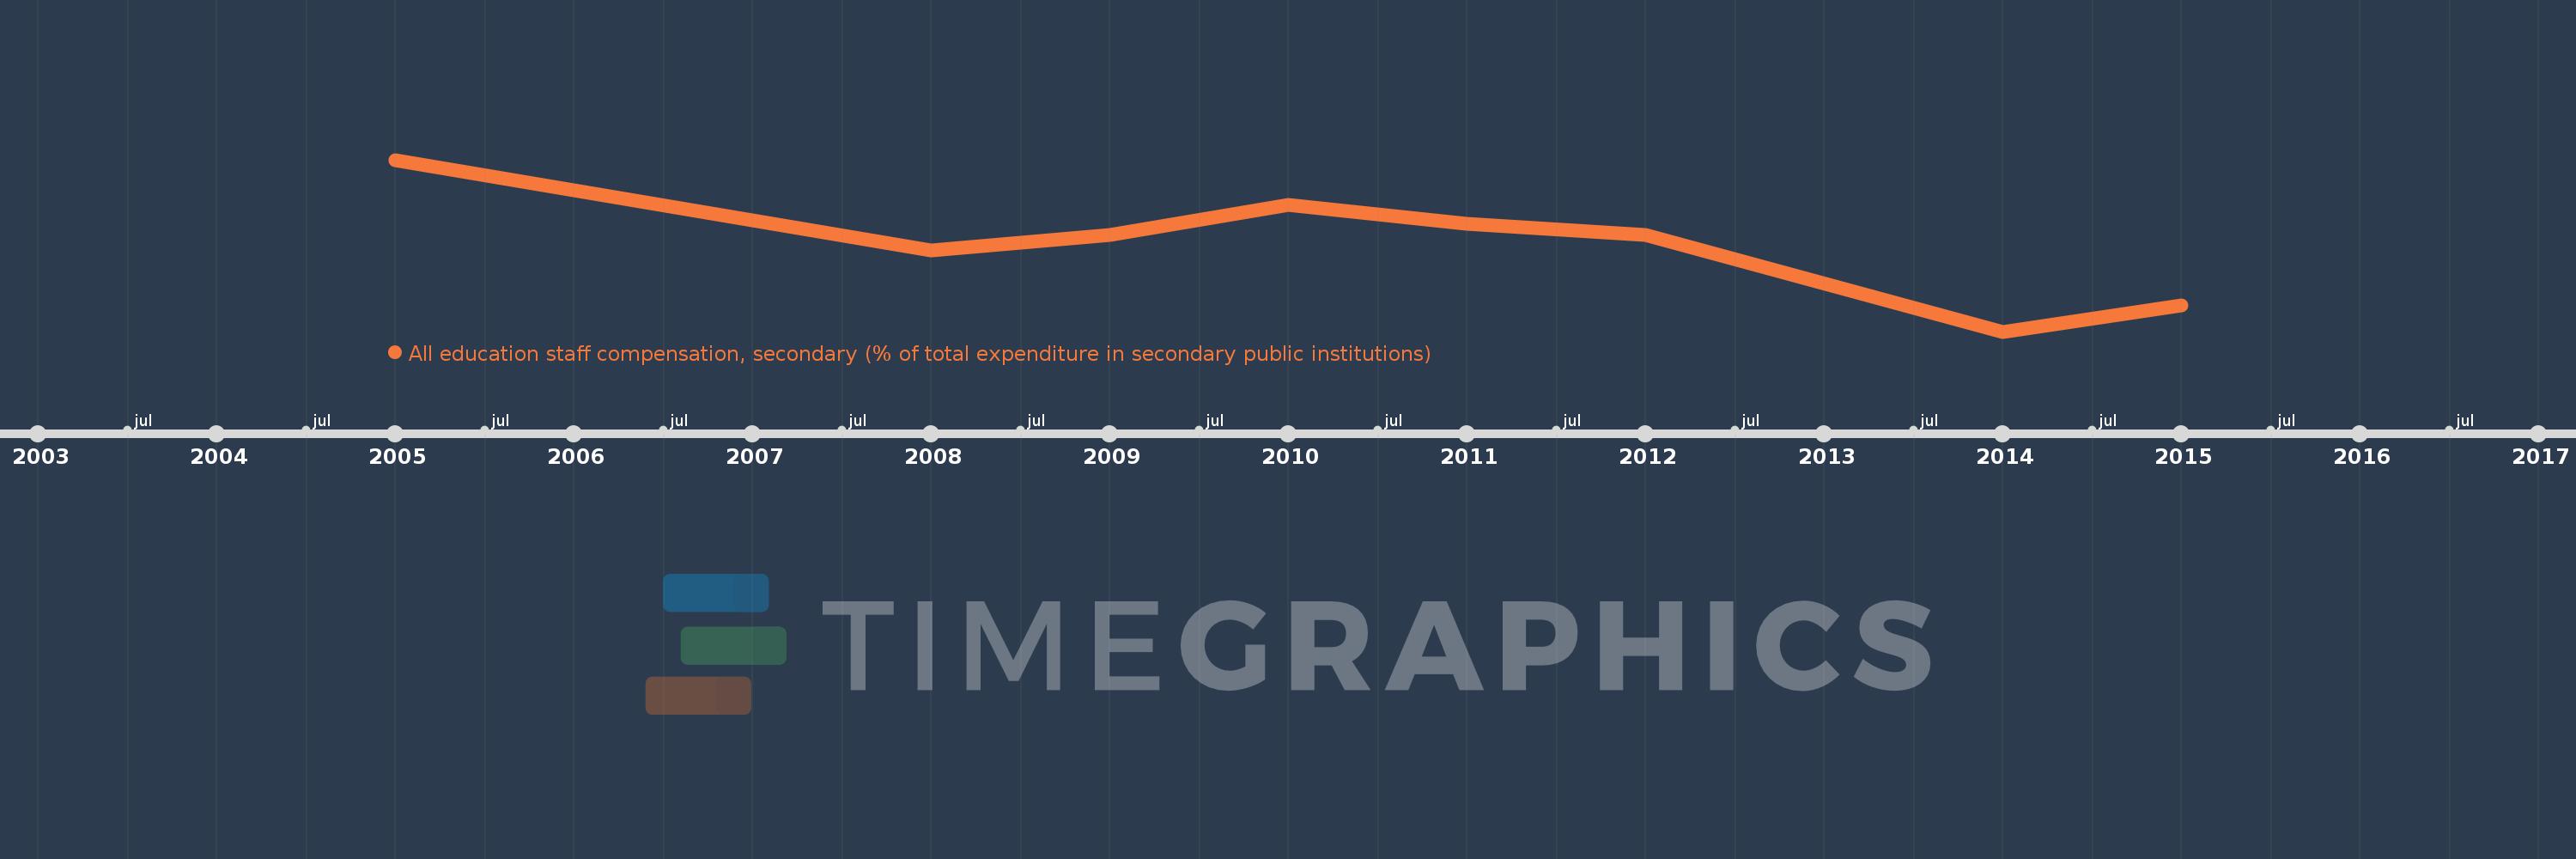
All education staff compensation, secondary (% of total expenditure in secondary public institutions)
2015,2014,2012,2011,2010,2009,2008,2005
This statistics in other country:
Timeline:
This timeline shows a graph from 2005 to 2015 of Dominican Republic. No data until 2004. Number of actual observations by date: 8.
Source name:
World Development Indicators
Source organization:
United Nations Educational, Scientific, and Cultural Organization (UNESCO) Institute for Statistics.
Categories, topics:
Education
Last updated:
apr 23, 2017
Indicators value changes by year
Minimum:
47.026
jan 1, 2014
Maximum:
96.184
jan 1, 2005
At the date of observation
Value
Absolute change
Change from previous value
jan 1, 2005
96.184
+96.184
0.0%
jan 1, 2008
70.296
-25.888
-26.91%
jan 1, 2009
74.673
+4.377
6.23%
jan 1, 2010
83.242
+8.569
11.48%
jan 1, 2011
77.871
-5.371
-6.45%
jan 1, 2012
74.627
-3.244
-4.17%
jan 1, 2014
47.026
-27.601
-36.99%
jan 1, 2015
54.48
+7.454
15.85%
Ranking of countries by current statistics by years


Comments: