29
/
en
AIzaSyAYiBZKx7MnpbEhh9jyipgxe19OcubqV5w
April 1, 2024
220449
Paraguay
PRY
true
2
1
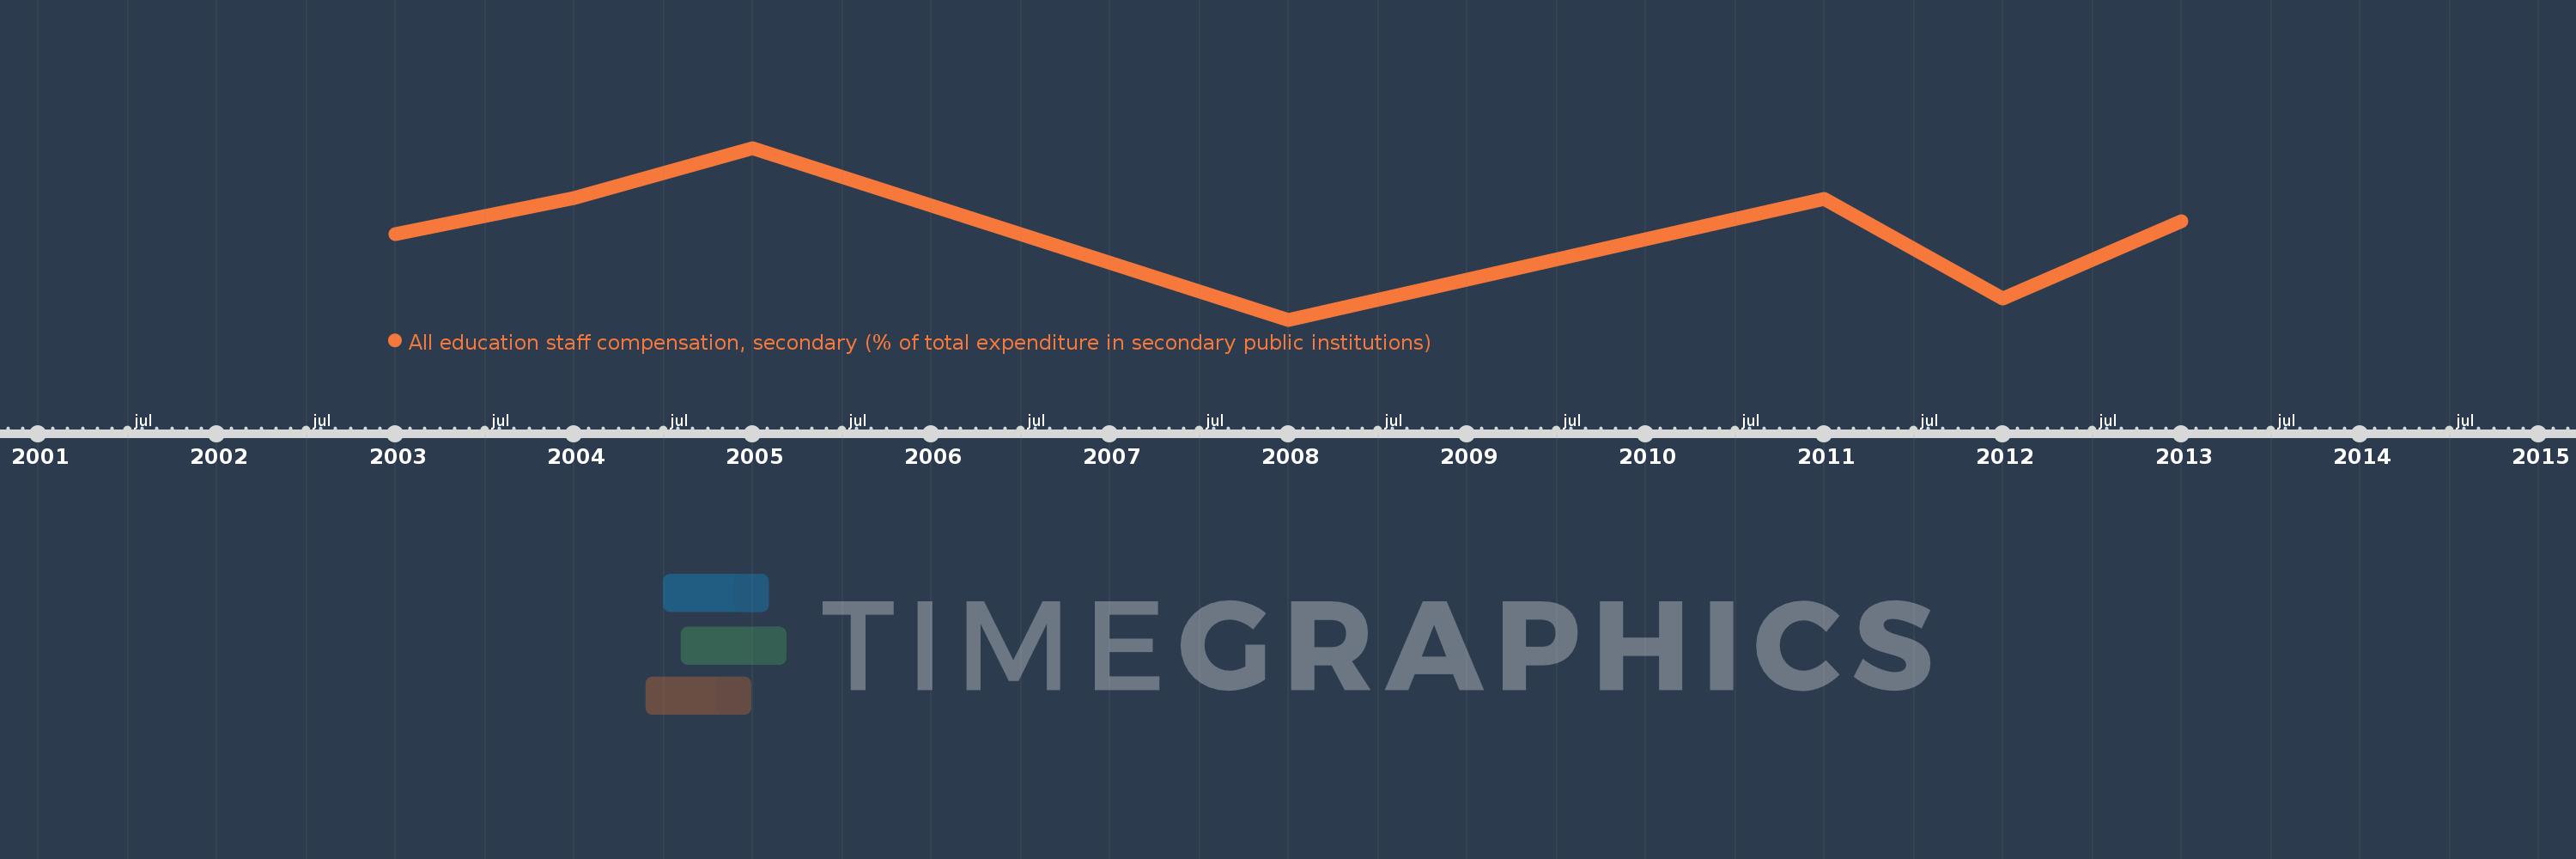
All education staff compensation, secondary (% of total expenditure in secondary public institutions)
2013,2012,2011,2008,2005,2004,2003
This statistics in other country:
Timeline:
This timeline shows a graph from 2003 to 2013 of Paraguay. No data until 2002. Number of actual observations by date: 7.
Source name:
World Development Indicators
Source organization:
United Nations Educational, Scientific, and Cultural Organization (UNESCO) Institute for Statistics.
Categories, topics:
Education
Last updated:
apr 23, 2017
Indicators value changes by year
Minimum:
80.242
jan 1, 2008
Maximum:
88.679
jan 1, 2005
At the date of observation
Value
Absolute change
Change from previous value
jan 1, 2003
84.467
+84.467
0.0%
jan 1, 2004
86.205
+1.739
2.06%
jan 1, 2005
88.679
+2.474
2.87%
jan 1, 2008
80.242
-8.437
-9.51%
jan 1, 2011
86.188
+5.946
7.41%
jan 1, 2012
81.301
-4.887
-5.67%
jan 1, 2013
85.077
+3.776
4.64%
Ranking of countries by current statistics by years


Comments: