29
/
en
AIzaSyAYiBZKx7MnpbEhh9jyipgxe19OcubqV5w
April 1, 2024
211346
Niger
NER
true
2
1
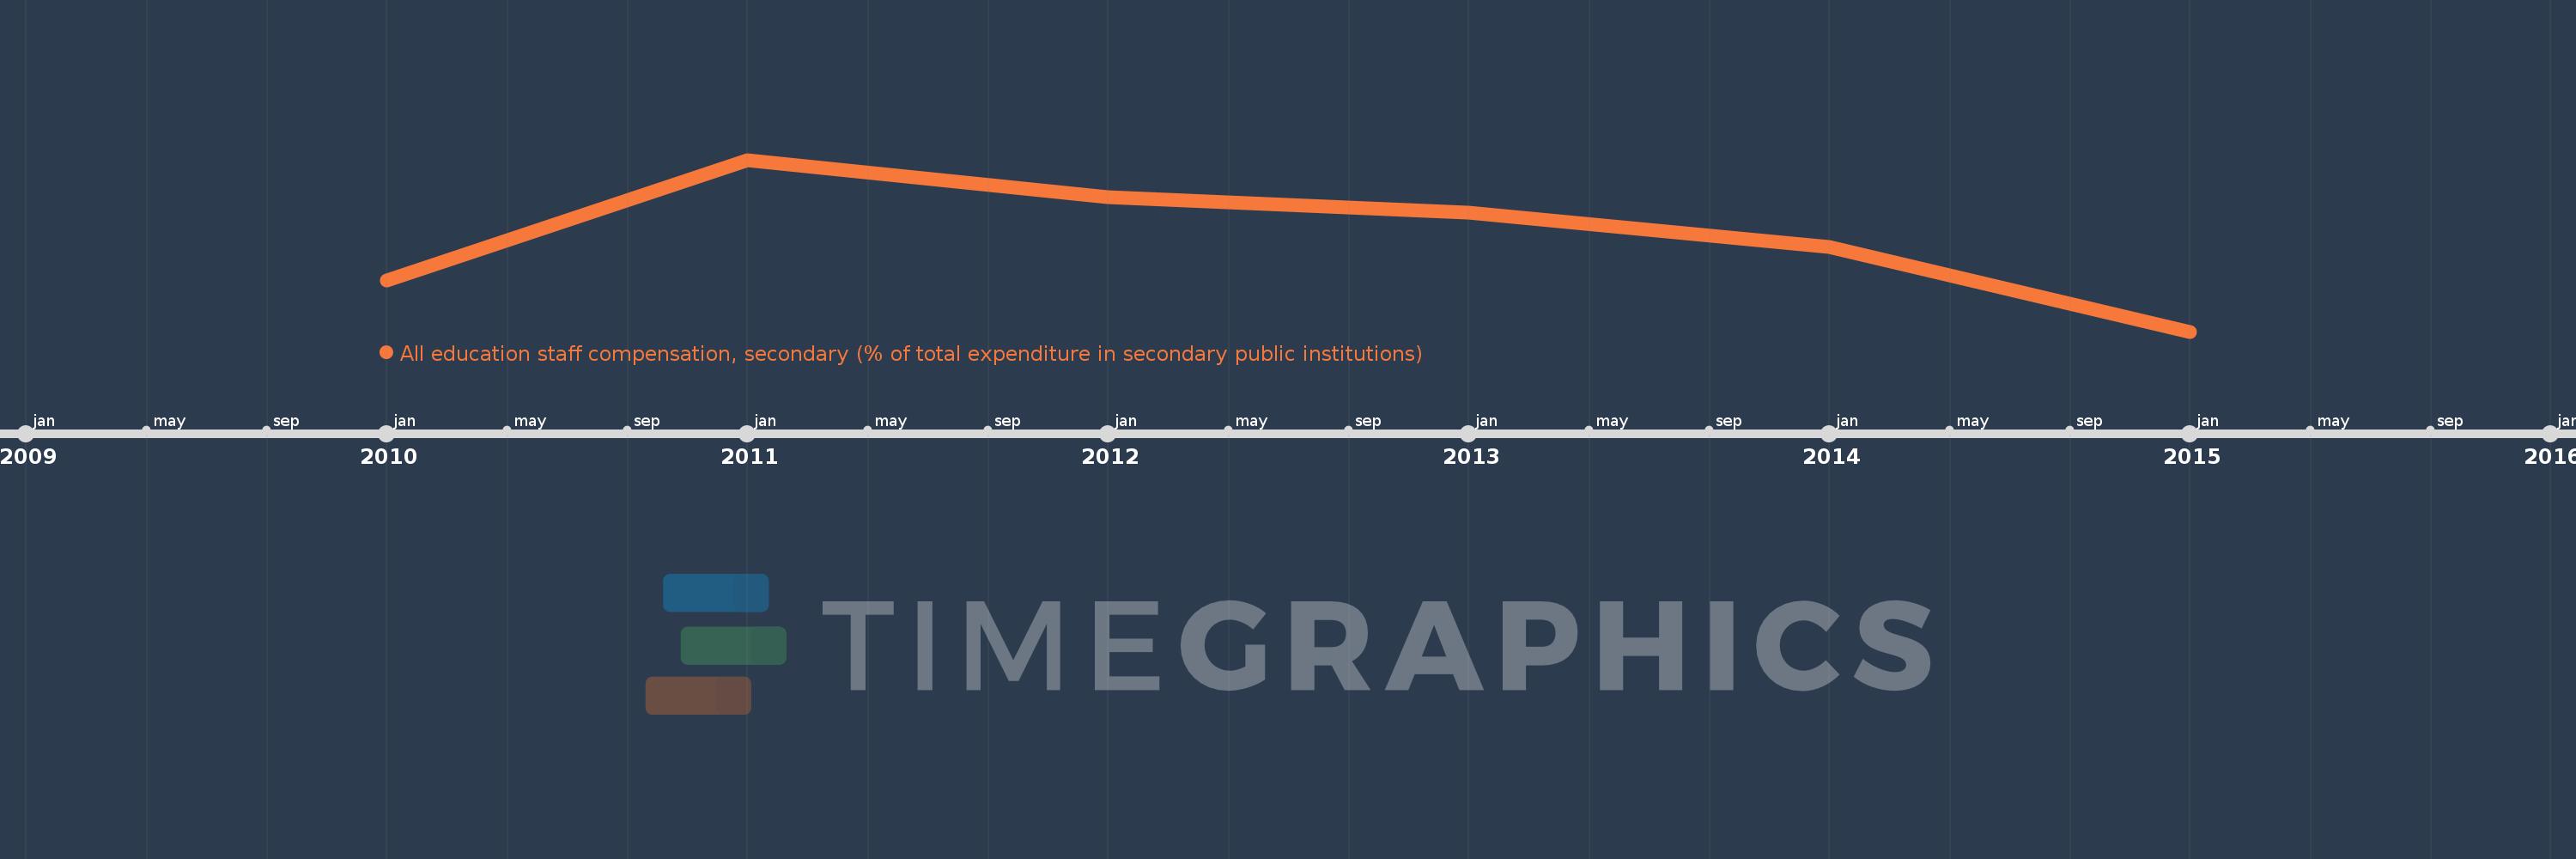
All education staff compensation, secondary (% of total expenditure in secondary public institutions)
2015,2014,2013,2012,2011,2010
This statistics in other country:
Timeline:
This timeline shows a graph from 2010 to 2015 of Niger. No data until 2009. Number of actual observations by date: 6.
Source name:
World Development Indicators
Source organization:
United Nations Educational, Scientific, and Cultural Organization (UNESCO) Institute for Statistics.
Categories, topics:
Education
Last updated:
apr 23, 2017
Indicators value changes by year
Minimum:
44.732
jan 1, 2015
Maximum:
83.536
jan 1, 2011
At the date of observation
Value
Absolute change
Change from previous value
jan 1, 2010
56.261
+56.261
0.0%
jan 1, 2011
83.536
+27.275
48.48%
jan 1, 2012
75.092
-8.444
-10.11%
jan 1, 2013
71.69
-3.401
-4.53%
jan 1, 2014
63.757
-7.934
-11.07%
jan 1, 2015
44.732
-19.025
-29.84%
Ranking of countries by current statistics by years


Comments: