29
/
en
AIzaSyAYiBZKx7MnpbEhh9jyipgxe19OcubqV5w
April 1, 2024
118648
Denmark
DNK
true
2
1
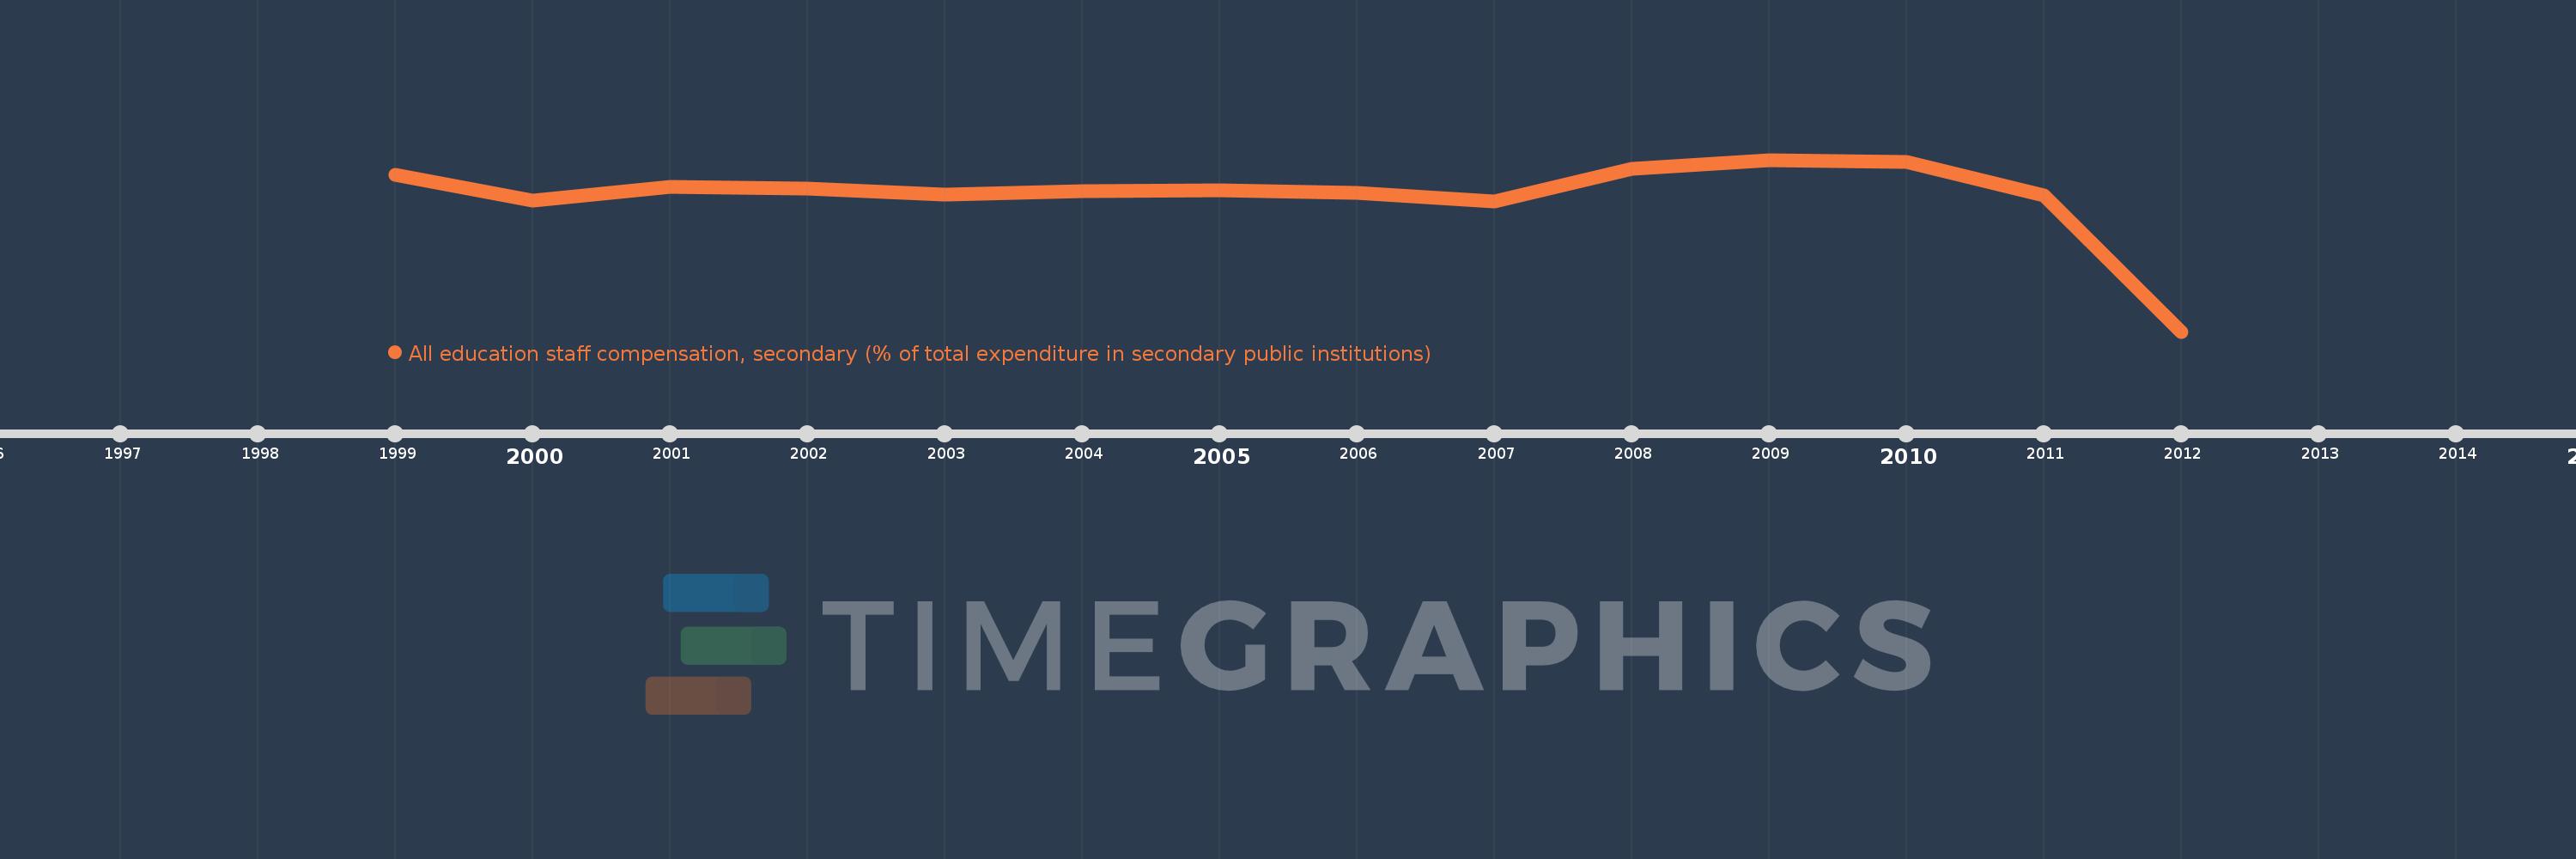
All education staff compensation, secondary (% of total expenditure in secondary public institutions)
2012,2011,2010,2009,2008,2007,2006,2005,2004,2003,2002,2001,2000,1999
This statistics in other country:
Timeline:
This timeline shows a graph from 1999 to 2012 of Denmark. No data until 1998. Number of actual observations by date: 14.
Source name:
World Development Indicators
Source organization:
United Nations Educational, Scientific, and Cultural Organization (UNESCO) Institute for Statistics.
Categories, topics:
Education
Last updated:
apr 23, 2017
Indicators value changes by year
Minimum:
53.416
jan 1, 2012
Maximum:
77.663
jan 1, 2009
At the date of observation
Value
Absolute change
Change from previous value
jan 1, 1999
75.521
+75.521
0.0%
jan 1, 2000
71.871
-3.65
-4.83%
jan 1, 2001
73.903
+2.032
2.83%
jan 1, 2002
73.542
-0.361
-0.49%
jan 1, 2003
72.744
-0.798
-1.08%
jan 1, 2004
73.213
+0.469
0.64%
jan 1, 2005
73.399
+0.186
0.25%
jan 1, 2006
72.986
-0.413
-0.56%
jan 1, 2007
71.795
-1.192
-1.63%
jan 1, 2008
76.431
+4.636
6.46%
jan 1, 2009
77.663
+1.232
1.61%
jan 1, 2010
77.321
-0.342
-0.44%
jan 1, 2011
72.681
-4.639
-6.0%
jan 1, 2012
53.416
-19.265
-26.51%
Ranking of countries by current statistics by years


Comments: