29
/
en
AIzaSyAYiBZKx7MnpbEhh9jyipgxe19OcubqV5w
April 1, 2024
89517
Botswana
BWA
true
2
1
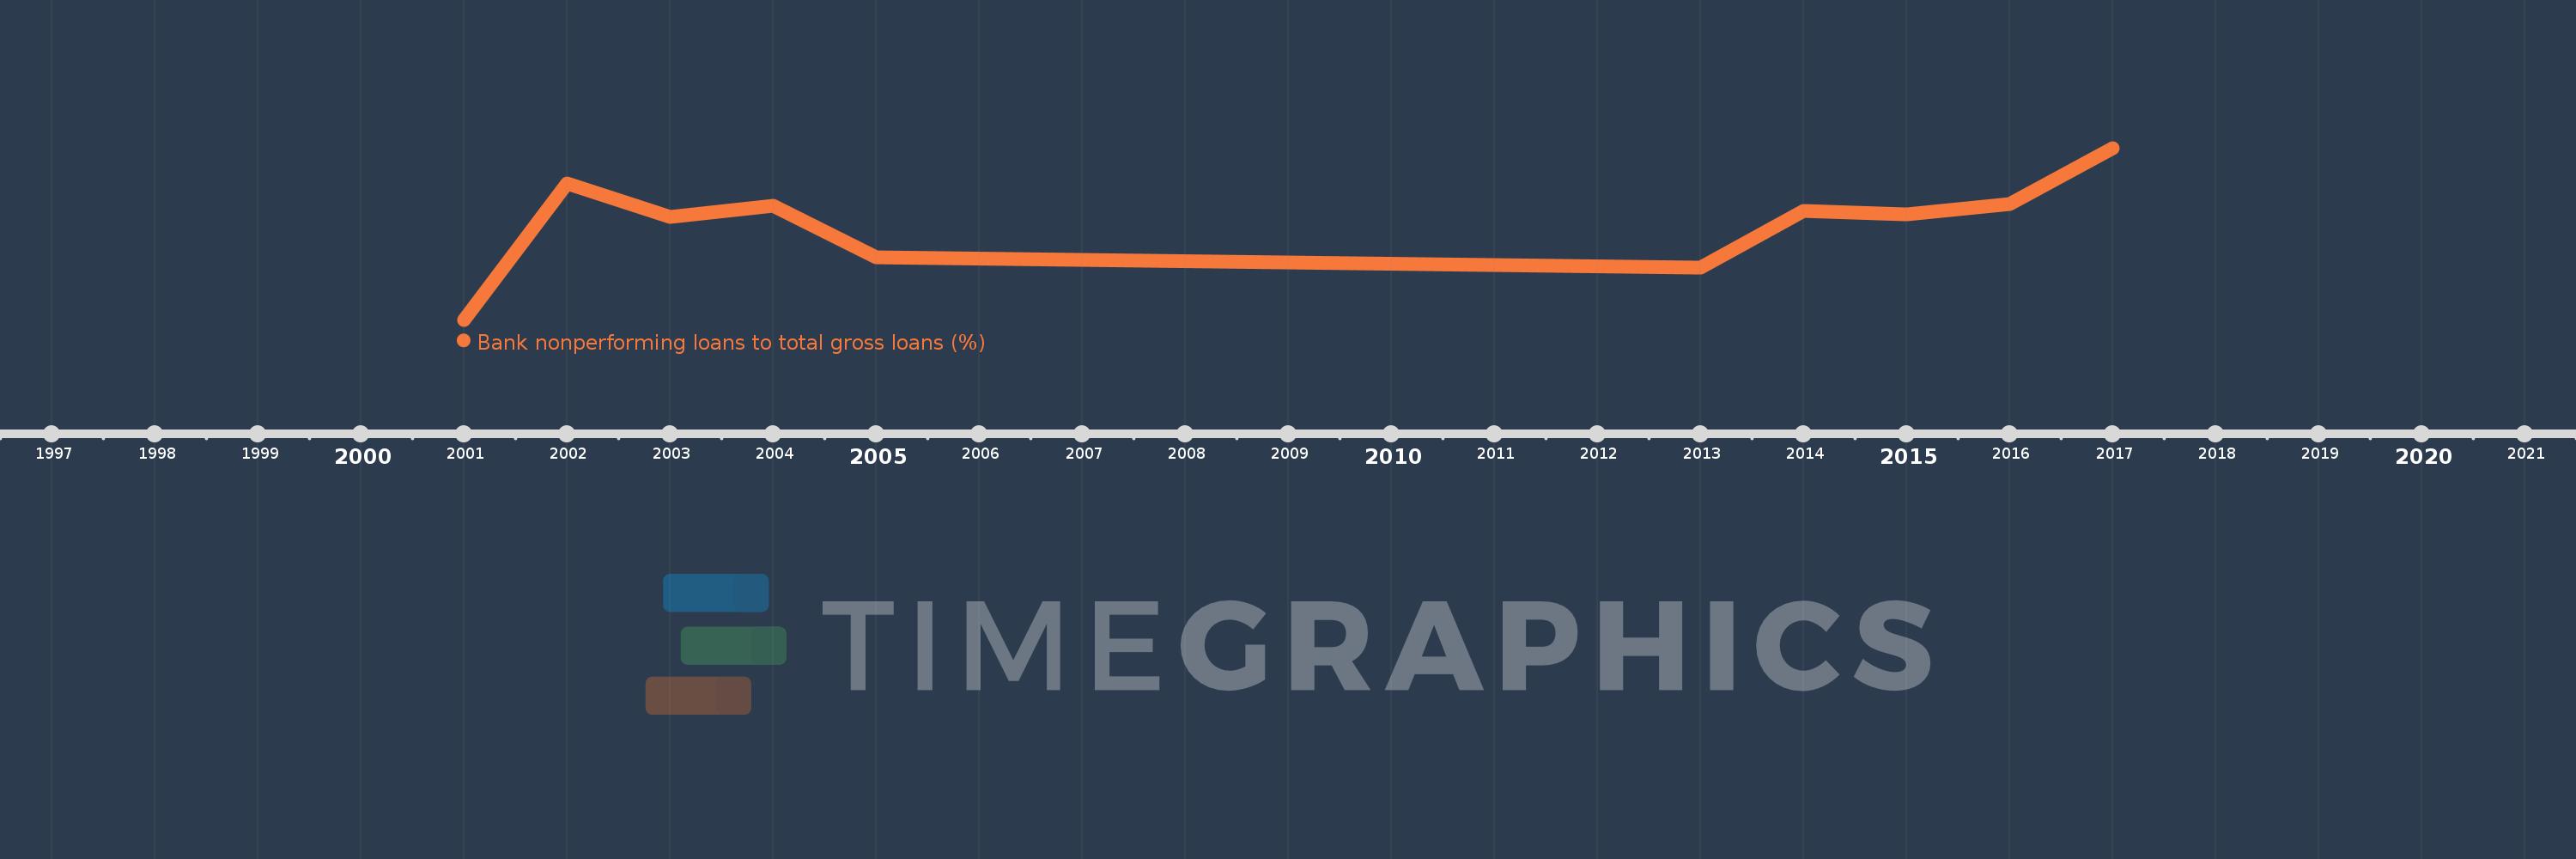
Bank nonperforming loans to total gross loans (%)
2017,2016,2015,2014,2013,2005,2004,2003,2002,2001
This statistics in other country:
Timeline:
This timeline shows a graph from 2001 to 2017 of Botswana. No data until 2000. Number of actual observations by date: 10.
Source name:
World Development Indicators
Source organization:
International Monetary Fund, Global Financial Stability Report.
Categories, topics:
Financial Sector
Last updated:
apr 23, 2017
Indicators value changes by year
At the date of observation
Value
Absolute change
Change from previous value
jan 1, 2002
4.1
+2.4
141.18%
jan 1, 2003
3.5
-0.6
-14.63%
jan 1, 2004
3.7
+0.2
5.71%
jan 1, 2005
2.8
-0.9
-24.32%
jan 1, 2013
2.621
-0.179
-6.41%
jan 1, 2014
3.613
+0.993
37.89%
jan 1, 2015
3.549
-0.064
-1.77%
jan 1, 2016
3.734
+0.185
5.21%
jan 1, 2017
4.716
+0.982
26.3%
Ranking of countries by current statistics by years


Comments: