29
/
en
AIzaSyAYiBZKx7MnpbEhh9jyipgxe19OcubqV5w
April 1, 2024
63266
Afghanistan
AFG
true
2
1
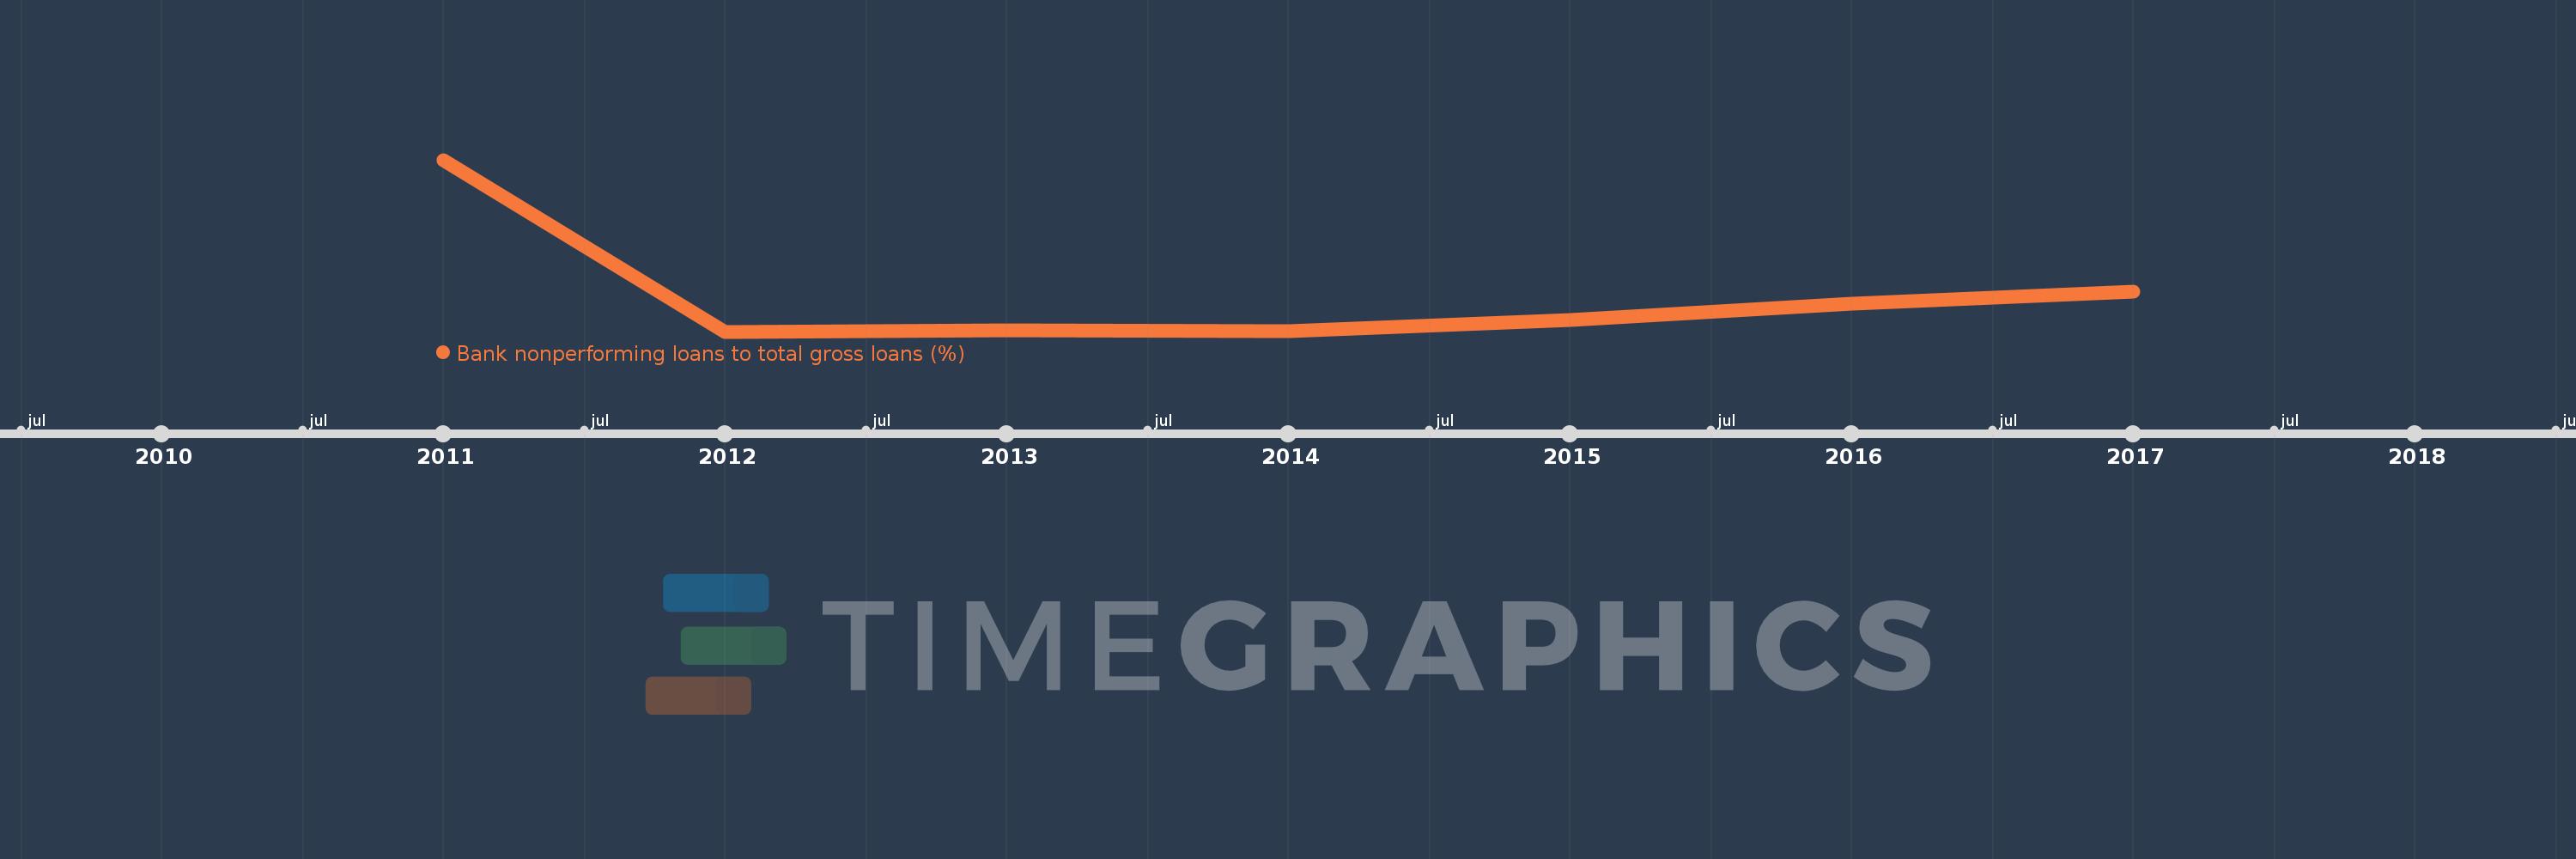
Bank nonperforming loans to total gross loans (%)
2017,2016,2015,2014,2013,2012,2011
This statistics in other country:
Timeline:
This timeline shows a graph from 2011 to 2017 of Afghanistan. No data until 2010. Number of actual observations by date: 7.
Source name:
World Development Indicators
Source organization:
International Monetary Fund, Global Financial Stability Report.
Categories, topics:
Financial Sector
Last updated:
apr 23, 2017
Indicators value changes by year
Maximum:
49.901
jan 1, 2011
At the date of observation
Value
Absolute change
Change from previous value
jan 1, 2011
49.901
+49.901
0.0%
jan 1, 2012
4.697
-45.205
-90.59%
jan 1, 2013
4.959
+0.262
5.58%
jan 1, 2014
4.852
-0.107
-2.15%
jan 1, 2015
7.781
+2.929
60.36%
jan 1, 2016
12.054
+4.273
54.91%
jan 1, 2017
15.198
+3.144
26.08%
Ranking of countries by current statistics by years


Comments: