29
/
en
AIzaSyAYiBZKx7MnpbEhh9jyipgxe19OcubqV5w
April 1, 2024
116654
Cyprus
CYP
true
2
1
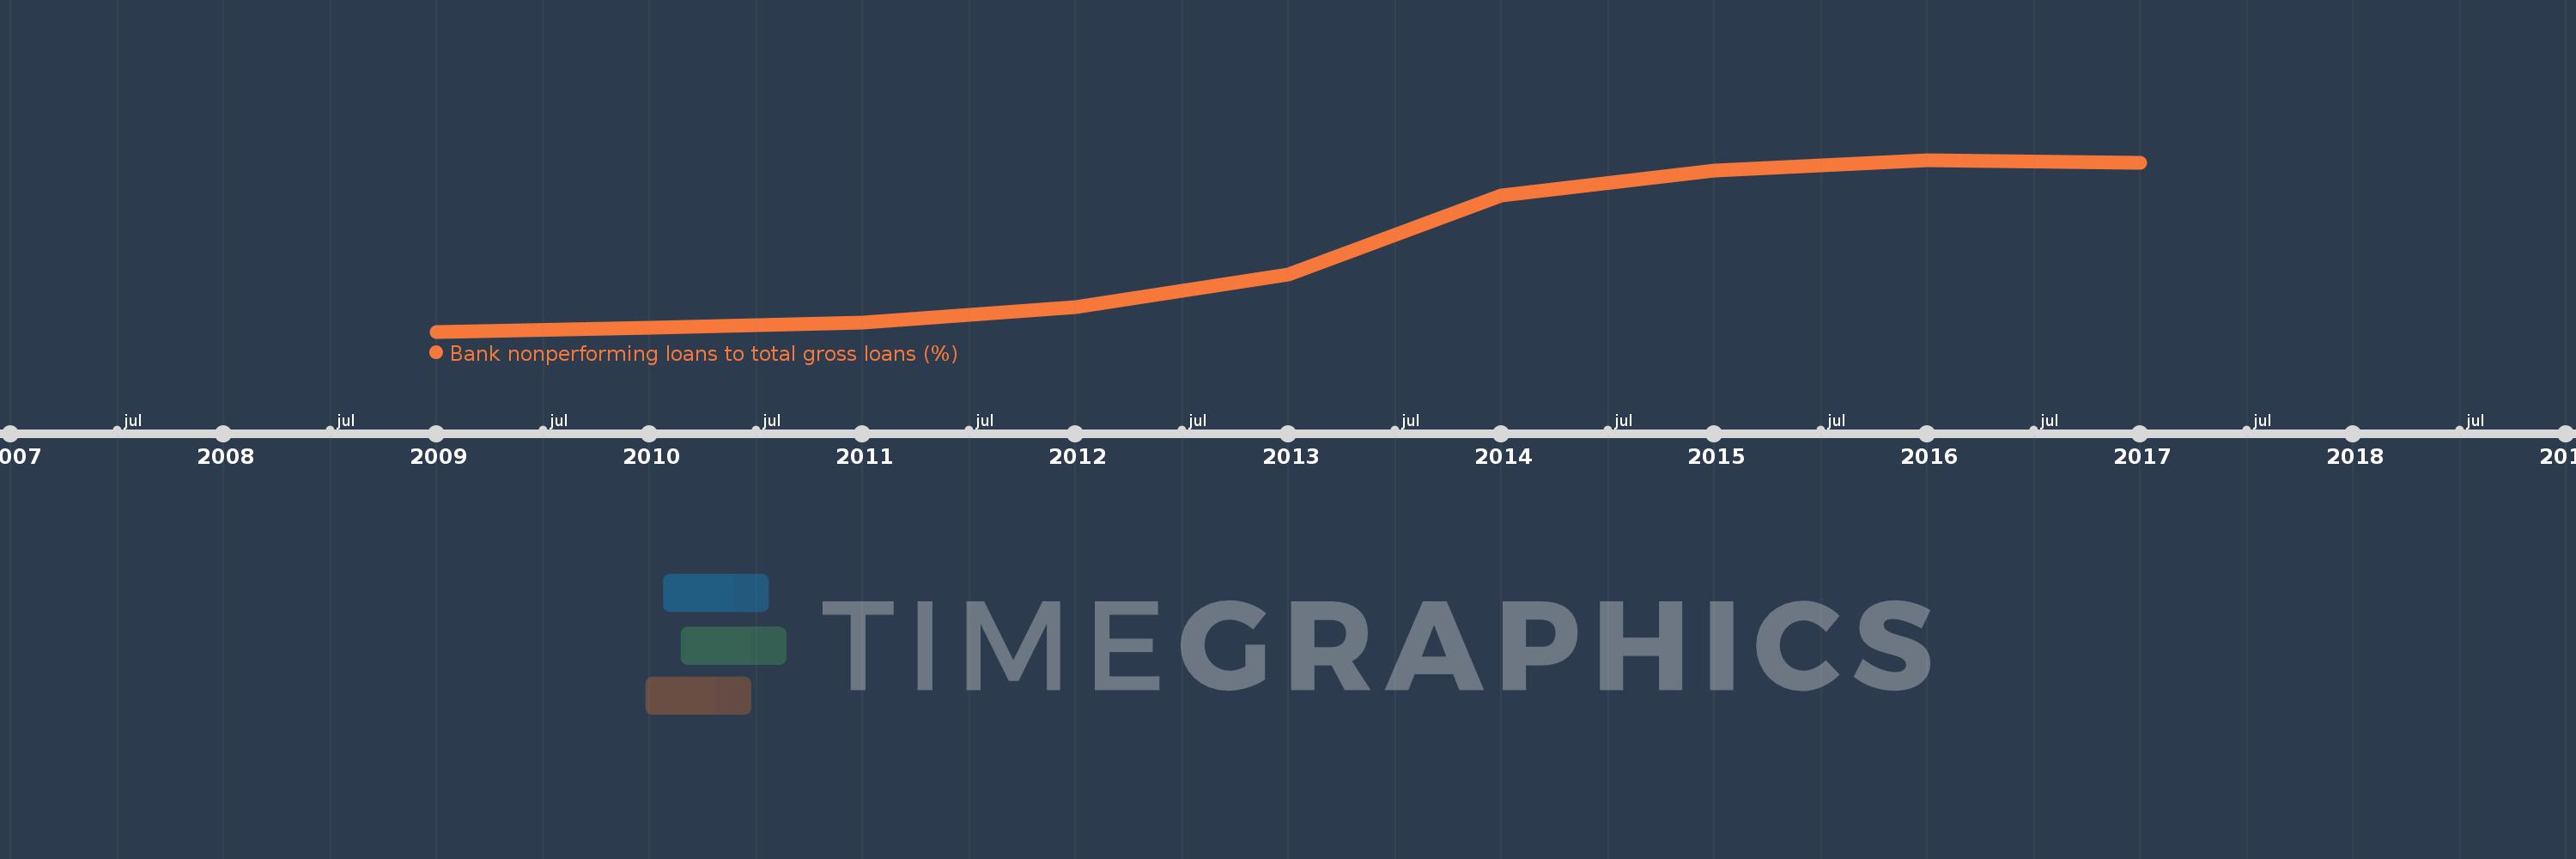
Bank nonperforming loans to total gross loans (%)
2017,2016,2015,2014,2013,2012,2011,2010,2009
This statistics in other country:
Timeline:
This timeline shows a graph from 2009 to 2017 of Cyprus. No data until 2008. Number of actual observations by date: 9.
Source name:
World Development Indicators
Source organization:
International Monetary Fund, Global Financial Stability Report.
Categories, topics:
Financial Sector
Last updated:
apr 23, 2017
Indicators value changes by year
Maximum:
47.748
jan 1, 2016
At the date of observation
Value
Absolute change
Change from previous value
jan 1, 2009
3.594
+3.594
0.0%
jan 1, 2010
4.509
+0.915
25.46%
jan 1, 2011
5.822
+1.312
29.1%
jan 1, 2012
9.986
+4.165
71.53%
jan 1, 2013
18.375
+8.389
84.0%
jan 1, 2014
38.557
+20.182
109.83%
jan 1, 2015
44.972
+6.415
16.64%
jan 1, 2016
47.748
+2.776
6.17%
jan 1, 2017
46.952
-0.796
-1.67%
Ranking of countries by current statistics by years


Comments: