29
/
en
AIzaSyAYiBZKx7MnpbEhh9jyipgxe19OcubqV5w
April 1, 2024
155632
Indonesia
IDN
true
2
1
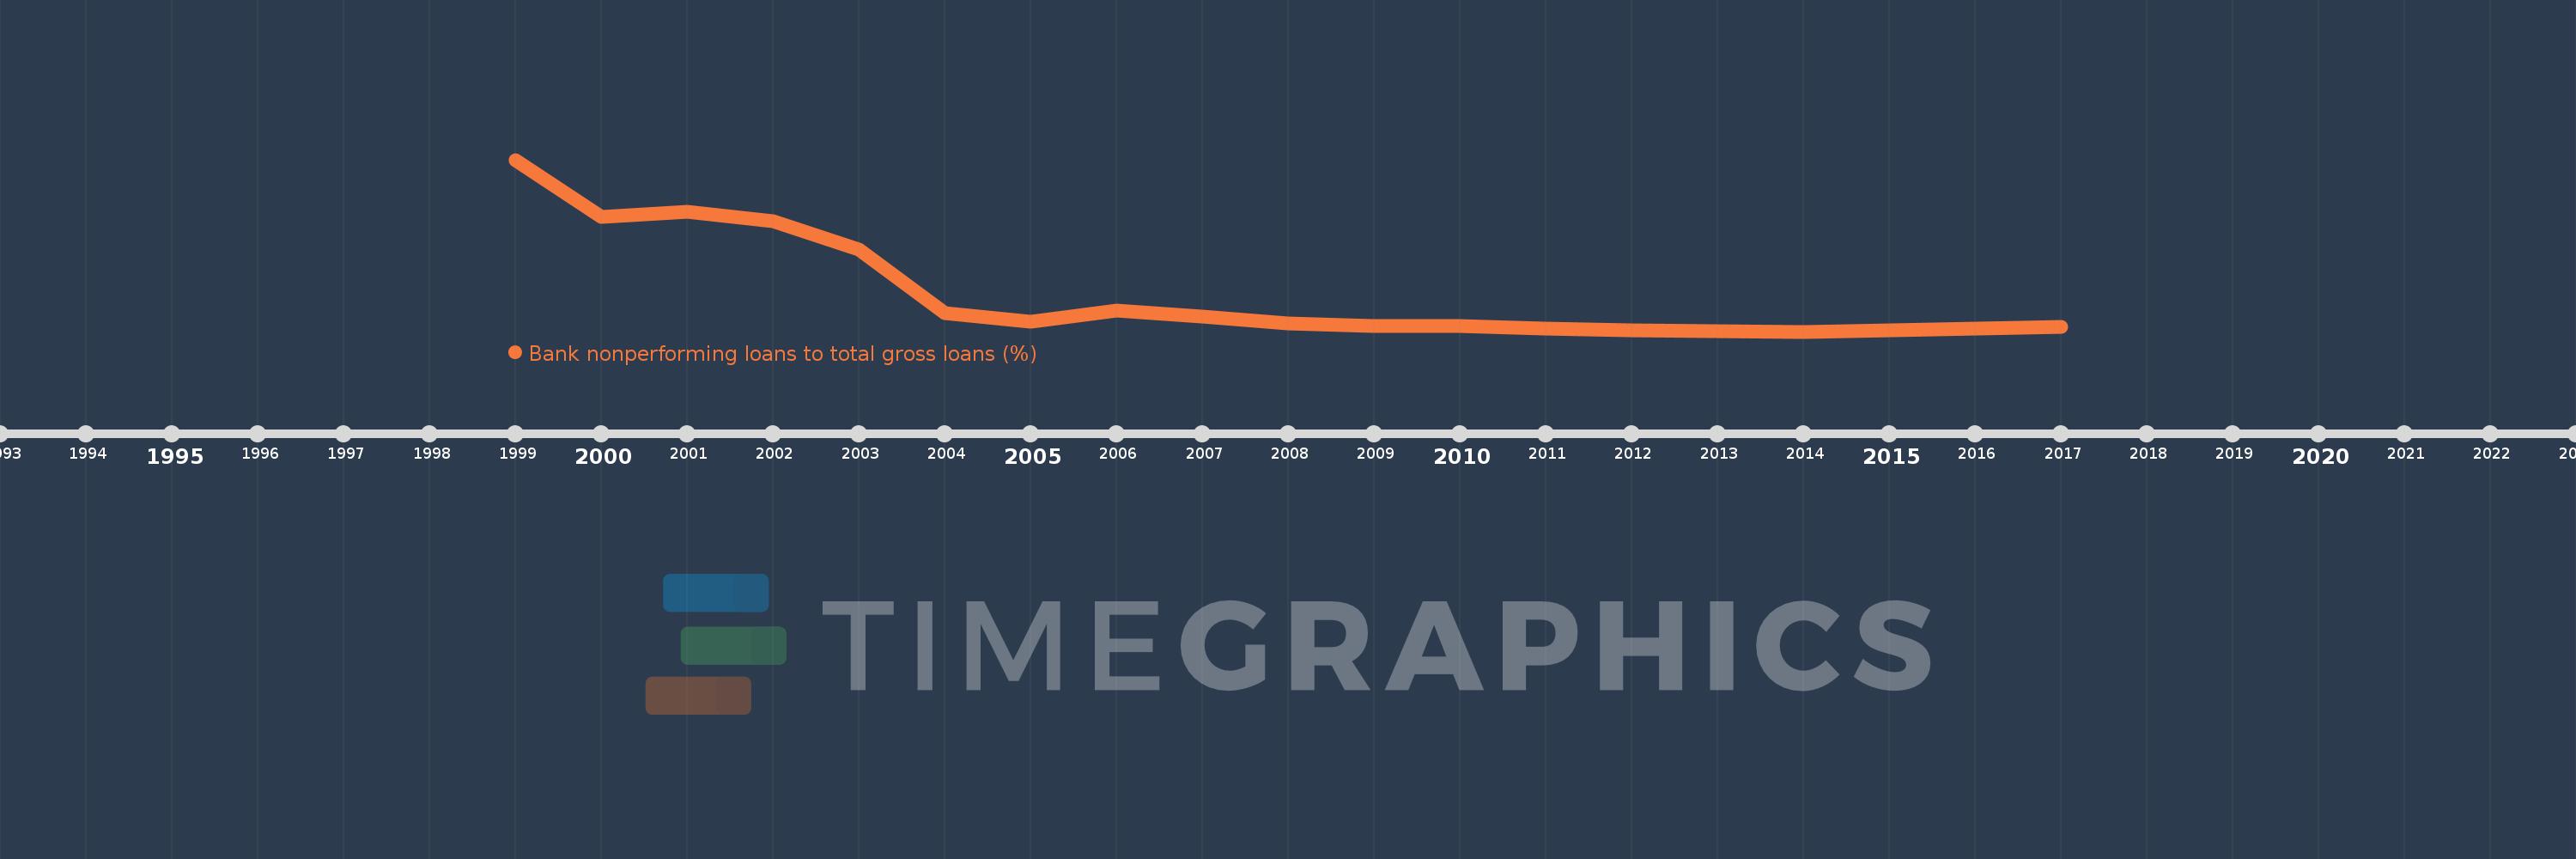
Bank nonperforming loans to total gross loans (%)
2017,2016,2015,2014,2013,2012,2011,2010,2009,2008,2007,2006,2005,2004,2003,2002,2001,2000,1999
This statistics in other country:
Timeline:
This timeline shows a graph from 1999 to 2017 of Indonesia. No data until 1998. Number of actual observations by date: 19.
Source name:
World Development Indicators
Source organization:
International Monetary Fund, Global Financial Stability Report.
Categories, topics:
Financial Sector
Last updated:
apr 23, 2017
Indicators value changes by year
At the date of observation
Value
Absolute change
Change from previous value
jan 1, 1999
48.6
+48.6
0.0%
jan 1, 2000
32.9
-15.7
-32.3%
jan 1, 2001
34.4
+1.5
4.56%
jan 1, 2002
31.9
-2.5
-7.27%
jan 1, 2003
24.0
-7.9
-24.76%
jan 1, 2004
6.8
-17.2
-71.67%
jan 1, 2005
4.5
-2.3
-33.82%
jan 1, 2006
7.333
+2.833
62.96%
jan 1, 2007
5.893
-1.44
-19.64%
jan 1, 2008
3.999
-1.894
-32.14%
jan 1, 2009
3.19
-0.809
-20.24%
jan 1, 2010
3.288
+0.099
3.09%
jan 1, 2011
2.532
-0.757
-23.01%
jan 1, 2012
2.144
-0.388
-15.31%
jan 1, 2013
1.773
-0.371
-17.29%
jan 1, 2014
1.687
-0.087
-4.88%
jan 1, 2015
2.067
+0.38
22.53%
jan 1, 2016
2.431
+0.364
17.62%
jan 1, 2017
2.981
+0.55
22.61%
Ranking of countries by current statistics by years


Comments: