29
/
en
AIzaSyAYiBZKx7MnpbEhh9jyipgxe19OcubqV5w
April 1, 2024
281957
Vietnam
VNM
true
2
1
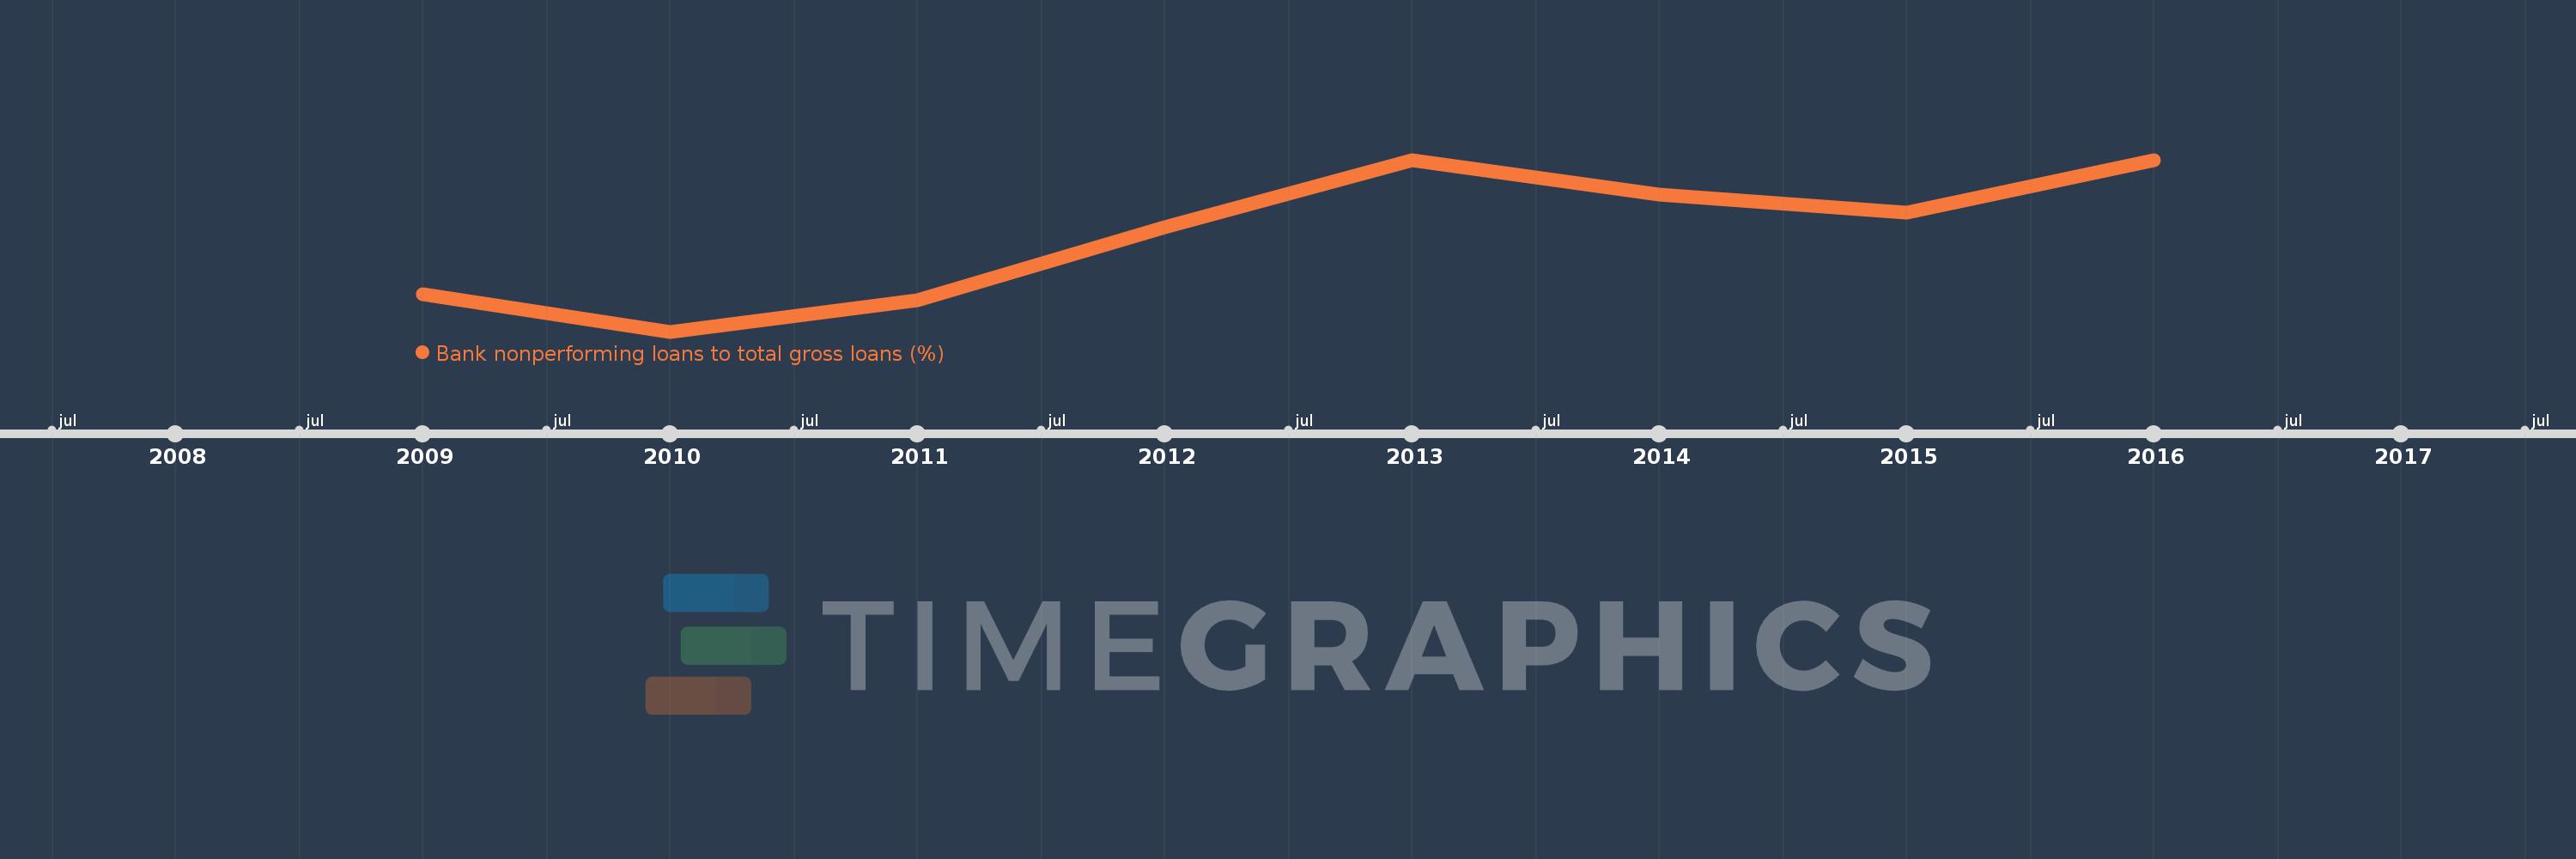
Bank nonperforming loans to total gross loans (%)
2016,2015,2014,2013,2012,2011,2010,2009
This statistics in other country:
Timeline:
This timeline shows a graph from 2009 to 2016 of Vietnam. No data until 2008. Number of actual observations by date: 8.
Source name:
World Development Indicators
Source organization:
International Monetary Fund, Global Financial Stability Report.
Categories, topics:
Financial Sector
Last updated:
apr 23, 2017
Indicators value changes by year
At the date of observation
Value
Absolute change
Change from previous value
jan 1, 2009
2.151
+2.151
0.0%
jan 1, 2010
1.797
-0.354
-16.48%
jan 1, 2011
2.093
+0.296
16.48%
jan 1, 2012
2.792
+0.699
33.43%
jan 1, 2013
3.438
+0.646
23.13%
jan 1, 2014
3.107
-0.331
-9.62%
jan 1, 2015
2.935
-0.172
-5.53%
jan 1, 2016
3.44
+0.505
17.2%
Ranking of countries by current statistics by years


Comments: