29
/
en
AIzaSyAYiBZKx7MnpbEhh9jyipgxe19OcubqV5w
April 1, 2024
268993
Turkey
TUR
true
2
1
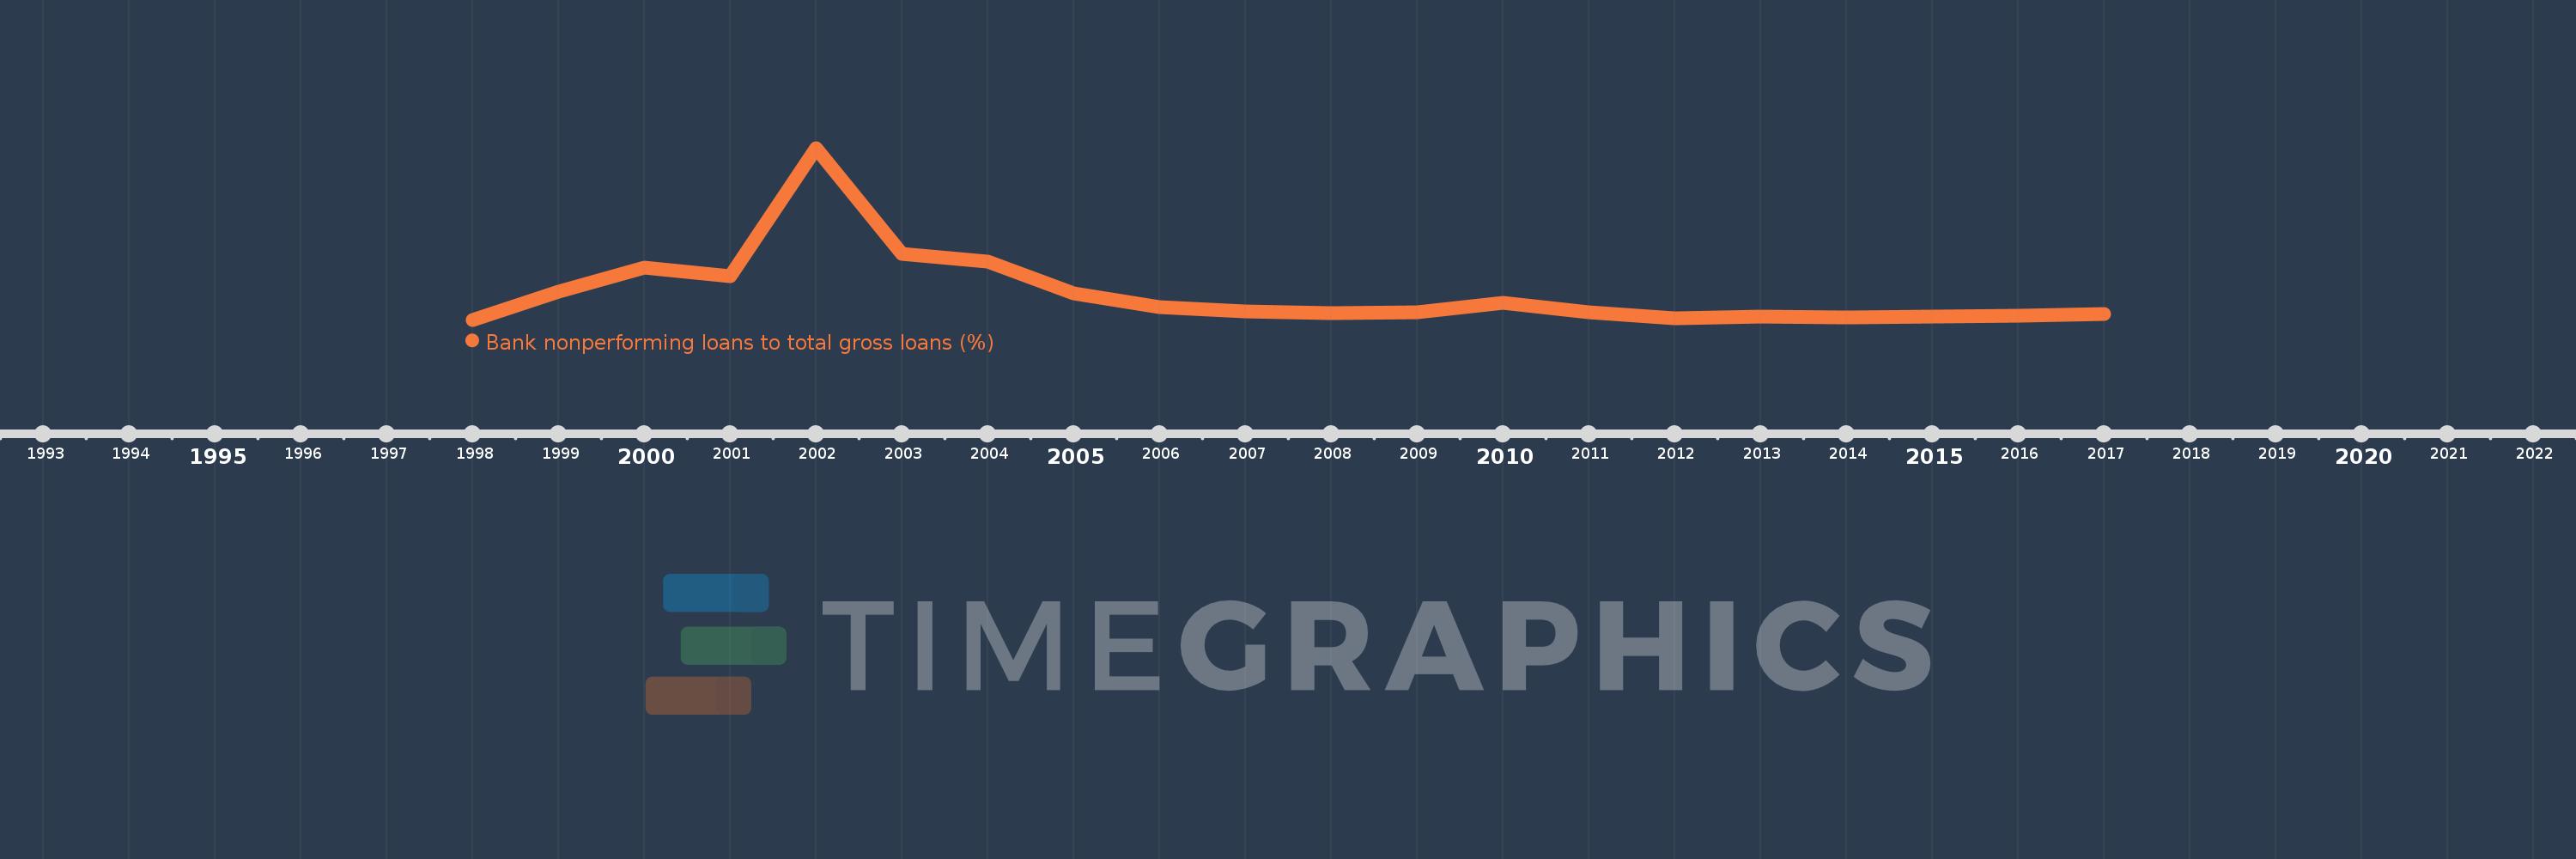
Bank nonperforming loans to total gross loans (%)
2017,2016,2015,2014,2013,2012,2011,2010,2009,2008,2007,2006,2005,2004,2003,2002,2001,2000,1999,1998
This statistics in other country:
Timeline:
This timeline shows a graph from 1998 to 2017 of Turkey. No data until 1997. Number of actual observations by date: 20.
Source name:
World Development Indicators
Source organization:
International Monetary Fund, Global Financial Stability Report.
Categories, topics:
Financial Sector
Last updated:
apr 23, 2017
Indicators value changes by year
At the date of observation
Value
Absolute change
Change from previous value
jan 1, 1999
6.7
+4.4
191.3%
jan 1, 2000
10.5
+3.8
56.72%
jan 1, 2001
9.2
-1.3
-12.38%
jan 1, 2002
29.3
+20.1
218.48%
jan 1, 2003
12.7
-16.6
-56.66%
jan 1, 2004
11.5
-1.2
-9.45%
jan 1, 2005
6.5
-5.0
-43.48%
jan 1, 2006
4.316
-2.184
-33.6%
jan 1, 2007
3.581
-0.735
-17.03%
jan 1, 2008
3.321
-0.26
-7.26%
jan 1, 2009
3.442
+0.121
3.63%
jan 1, 2010
4.97
+1.528
44.41%
jan 1, 2011
3.49
-1.48
-29.79%
jan 1, 2012
2.576
-0.913
-26.17%
jan 1, 2013
2.743
+0.167
6.48%
jan 1, 2014
2.636
-0.107
-3.9%
jan 1, 2015
2.742
+0.106
4.0%
jan 1, 2016
2.988
+0.246
8.97%
jan 1, 2017
3.174
+0.187
6.25%
Ranking of countries by current statistics by years


Comments: