29
/
en
AIzaSyAYiBZKx7MnpbEhh9jyipgxe19OcubqV5w
April 1, 2024
154268
India
IND
true
2
1
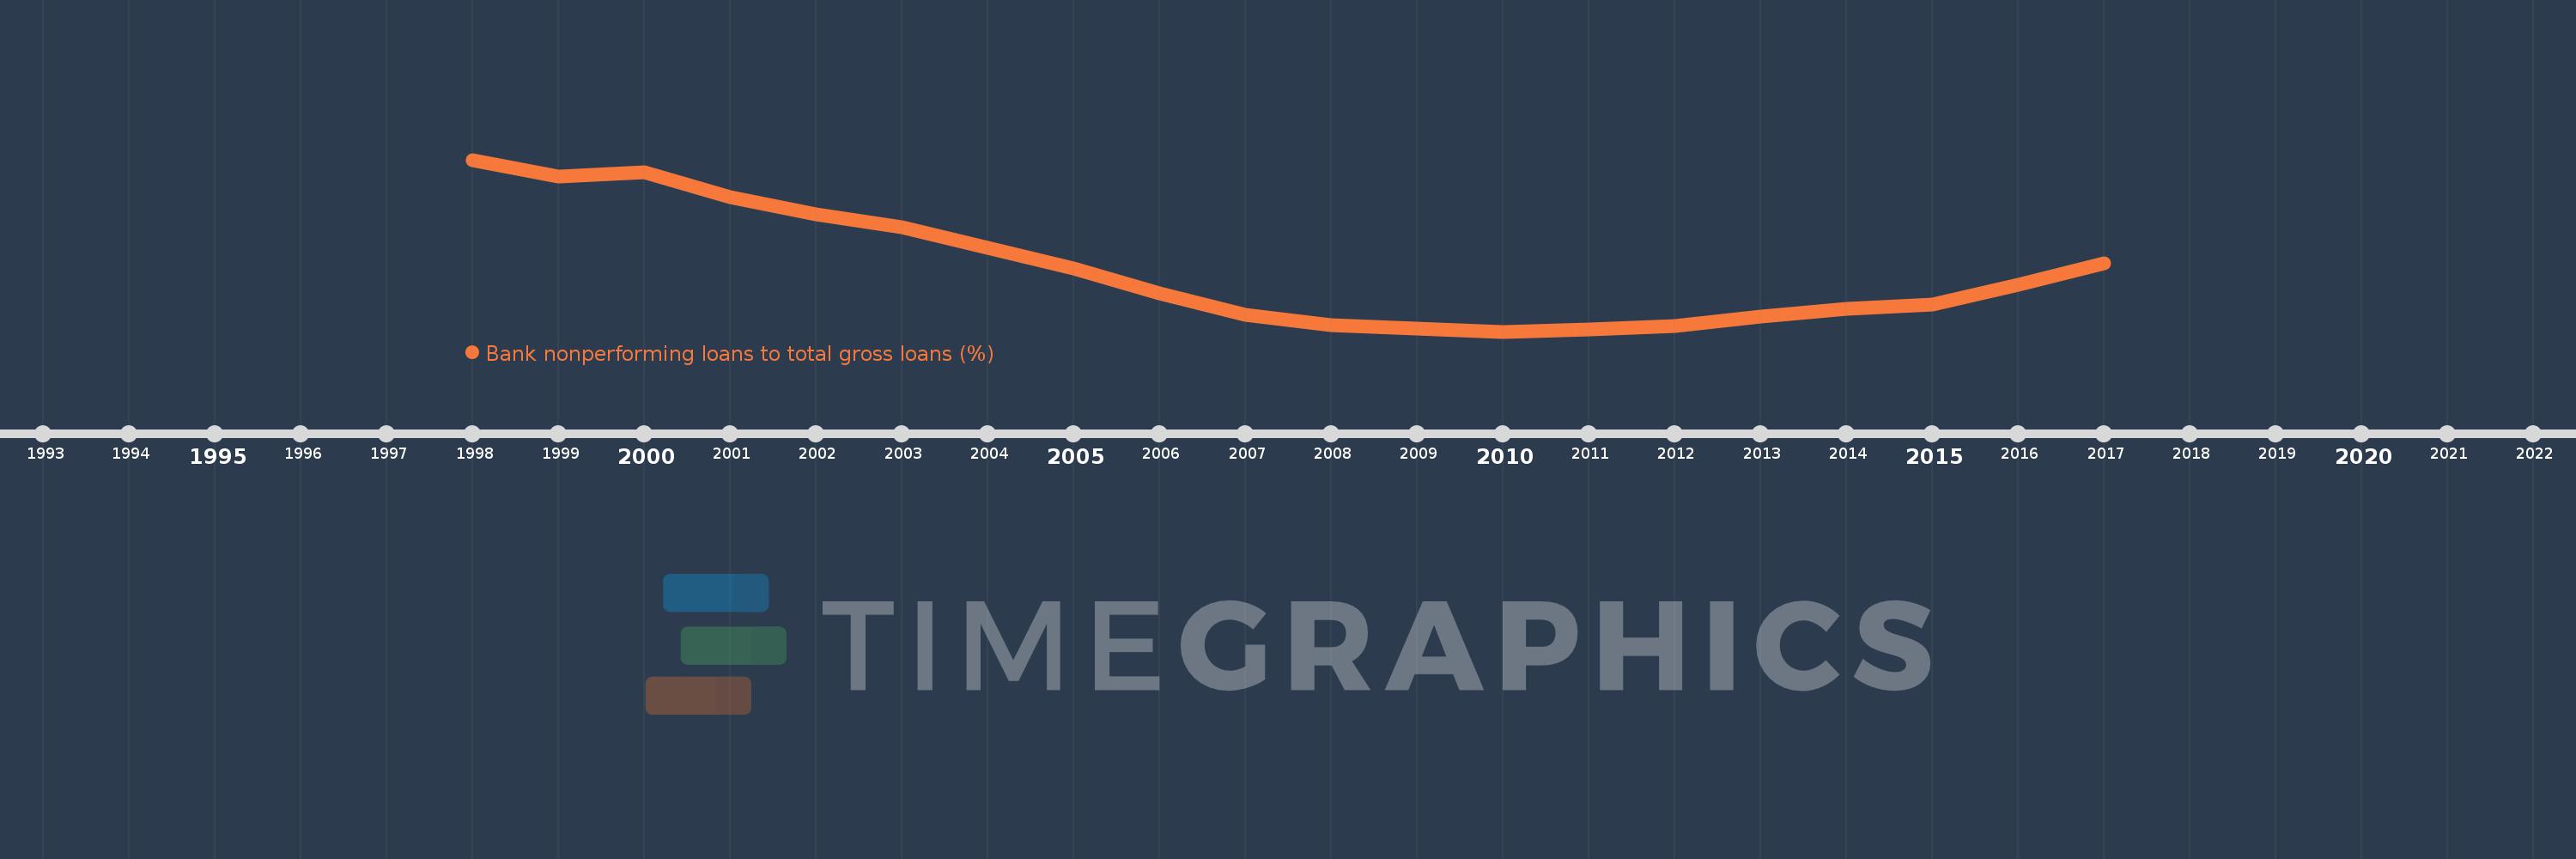
Bank nonperforming loans to total gross loans (%)
2017,2016,2015,2014,2013,2012,2011,2010,2009,2008,2007,2006,2005,2004,2003,2002,2001,2000,1999,1998
This statistics in other country:
Timeline:
This timeline shows a graph from 1998 to 2017 of India. No data until 1997. Number of actual observations by date: 20.
Source name:
World Development Indicators
Source organization:
International Monetary Fund, Global Financial Stability Report.
Categories, topics:
Financial Sector
Last updated:
apr 23, 2017
Indicators value changes by year
At the date of observation
Value
Absolute change
Change from previous value
jan 1, 1998
15.7
+15.7
0.0%
jan 1, 1999
14.4
-1.3
-8.28%
jan 1, 2000
14.7
+0.3
2.08%
jan 1, 2001
12.8
-1.9
-12.93%
jan 1, 2002
11.4
-1.4
-10.94%
jan 1, 2003
10.4
-1.0
-8.77%
jan 1, 2004
8.8
-1.6
-15.38%
jan 1, 2005
7.2
-1.6
-18.18%
jan 1, 2006
5.2
-2.0
-27.78%
jan 1, 2007
3.5
-1.7
-32.69%
jan 1, 2008
2.7
-0.8
-22.86%
jan 1, 2009
2.45
-0.25
-9.27%
jan 1, 2010
2.212
-0.238
-9.7%
jan 1, 2011
2.386
+0.174
7.86%
jan 1, 2012
2.67
+0.284
11.9%
jan 1, 2013
3.374
+0.704
26.36%
jan 1, 2014
4.028
+0.654
19.38%
jan 1, 2015
4.346
+0.318
7.9%
jan 1, 2016
5.884
+1.538
35.38%
jan 1, 2017
7.573
+1.689
28.71%
Ranking of countries by current statistics by years


Comments: