29
/
en
AIzaSyAYiBZKx7MnpbEhh9jyipgxe19OcubqV5w
April 1, 2024
29682
Euro area
EMU
false
2
1
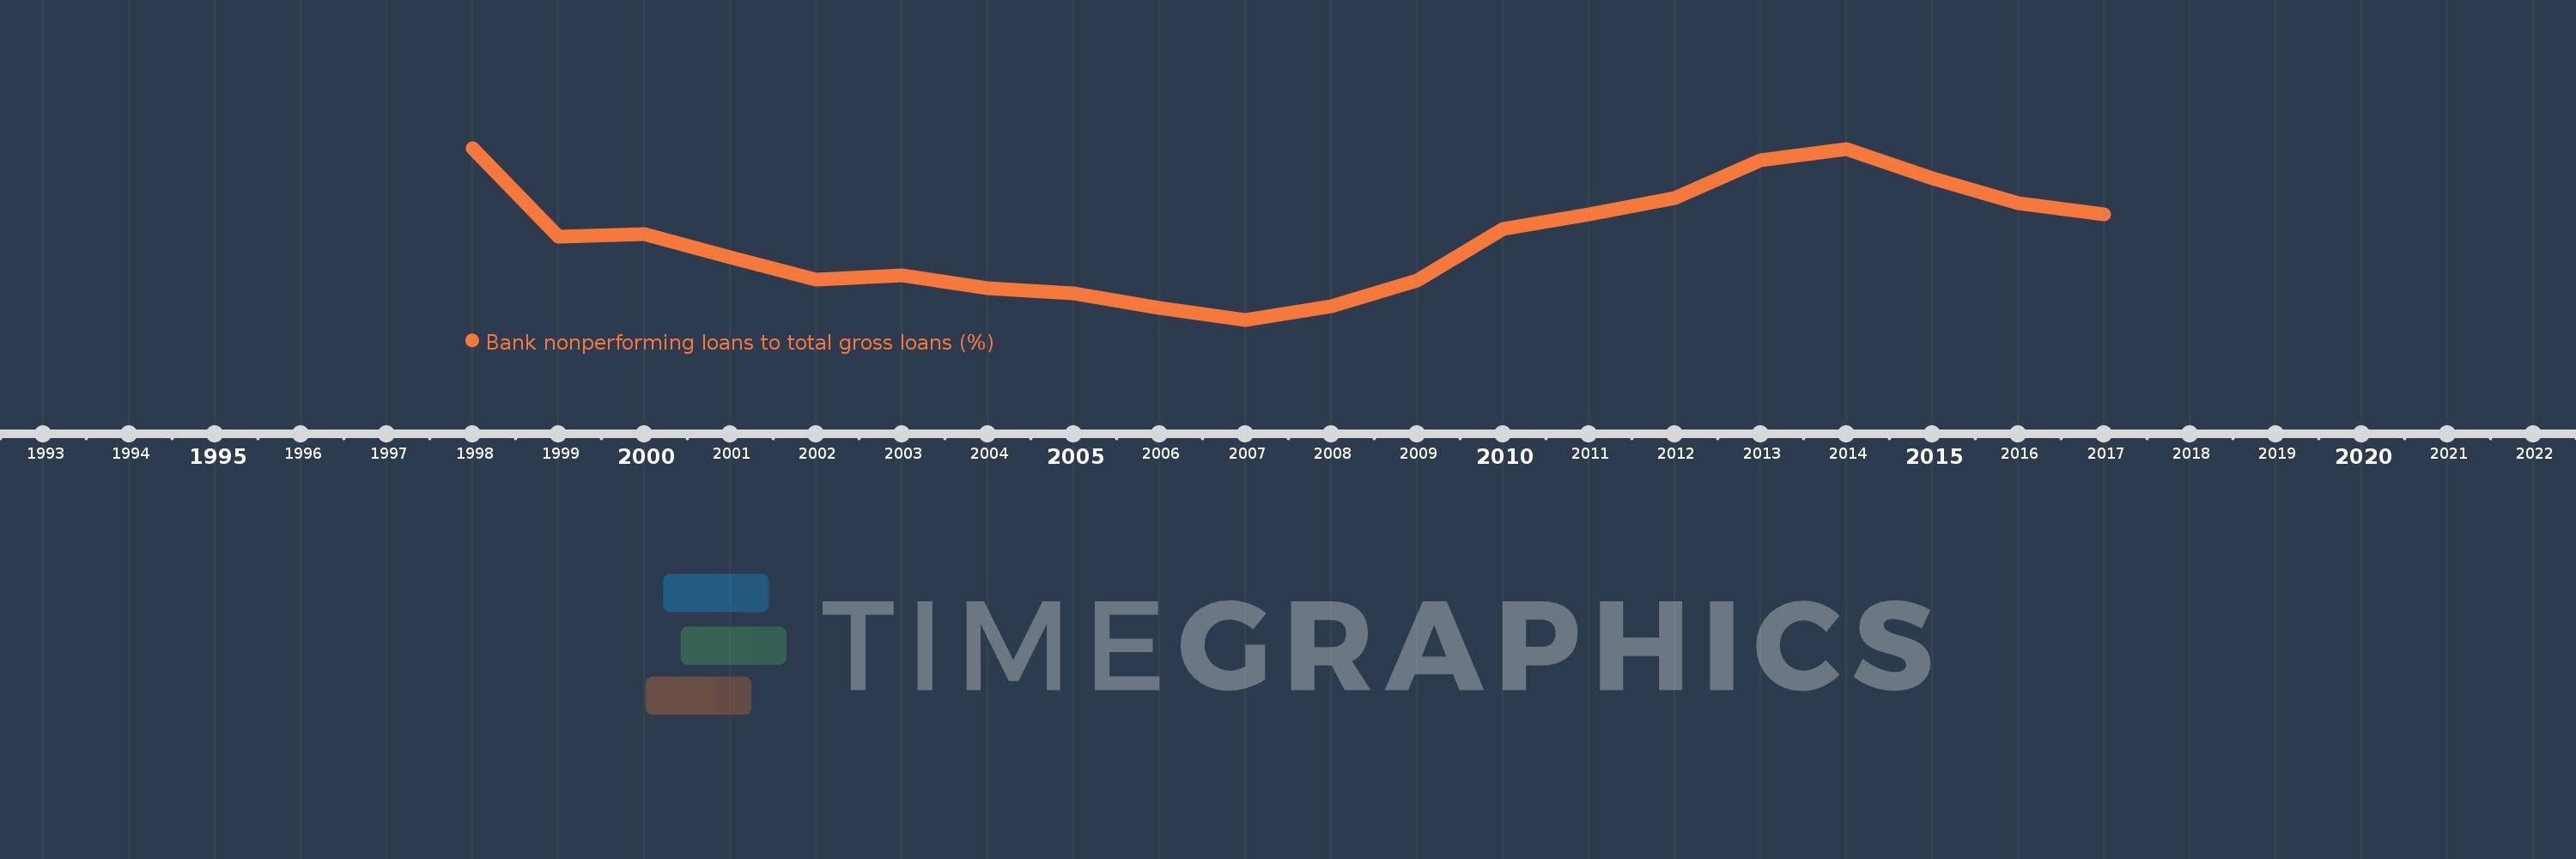
Bank nonperforming loans to total gross loans (%)
2017,2016,2015,2014,2013,2012,2011,2010,2009,2008,2007,2006,2005,2004,2003,2002,2001,2000,1999,1998
This statistics in other country:
Timeline:
This timeline shows a graph from 1998 to 2017 of Euro area. No data until 1997. Number of actual observations by date: 20.
Source name:
World Development Indicators
Source organization:
International Monetary Fund, Global Financial Stability Report.
Categories, topics:
Financial Sector
Last updated:
apr 23, 2017
Indicators value changes by year
At the date of observation
Value
Absolute change
Change from previous value
jan 1, 1998
7.95
+7.95
0.0%
jan 1, 1999
4.5
-3.45
-43.4%
jan 1, 2000
4.6
+0.1
2.22%
jan 1, 2001
3.7
-0.9
-19.57%
jan 1, 2002
2.85
-0.85
-22.97%
jan 1, 2003
3.0
+0.15
5.26%
jan 1, 2004
2.5
-0.5
-16.67%
jan 1, 2005
2.3
-0.2
-8.0%
jan 1, 2006
1.75
-0.55
-23.91%
jan 1, 2007
1.29
-0.46
-26.29%
jan 1, 2008
1.8
+0.51
39.53%
jan 1, 2009
2.808
+1.008
55.98%
jan 1, 2010
4.825
+2.017
71.84%
jan 1, 2011
5.375
+0.551
11.42%
jan 1, 2012
6.007
+0.632
11.75%
jan 1, 2013
7.484
+1.477
24.58%
jan 1, 2014
7.894
+0.41
5.48%
jan 1, 2015
6.766
-1.127
-14.28%
jan 1, 2016
5.797
-0.97
-14.33%
jan 1, 2017
5.383
-0.414
-7.14%
Ranking of countries by current statistics by years


Comments: