29
/
en
AIzaSyAYiBZKx7MnpbEhh9jyipgxe19OcubqV5w
April 1, 2024
214066
Norway
NOR
true
2
1
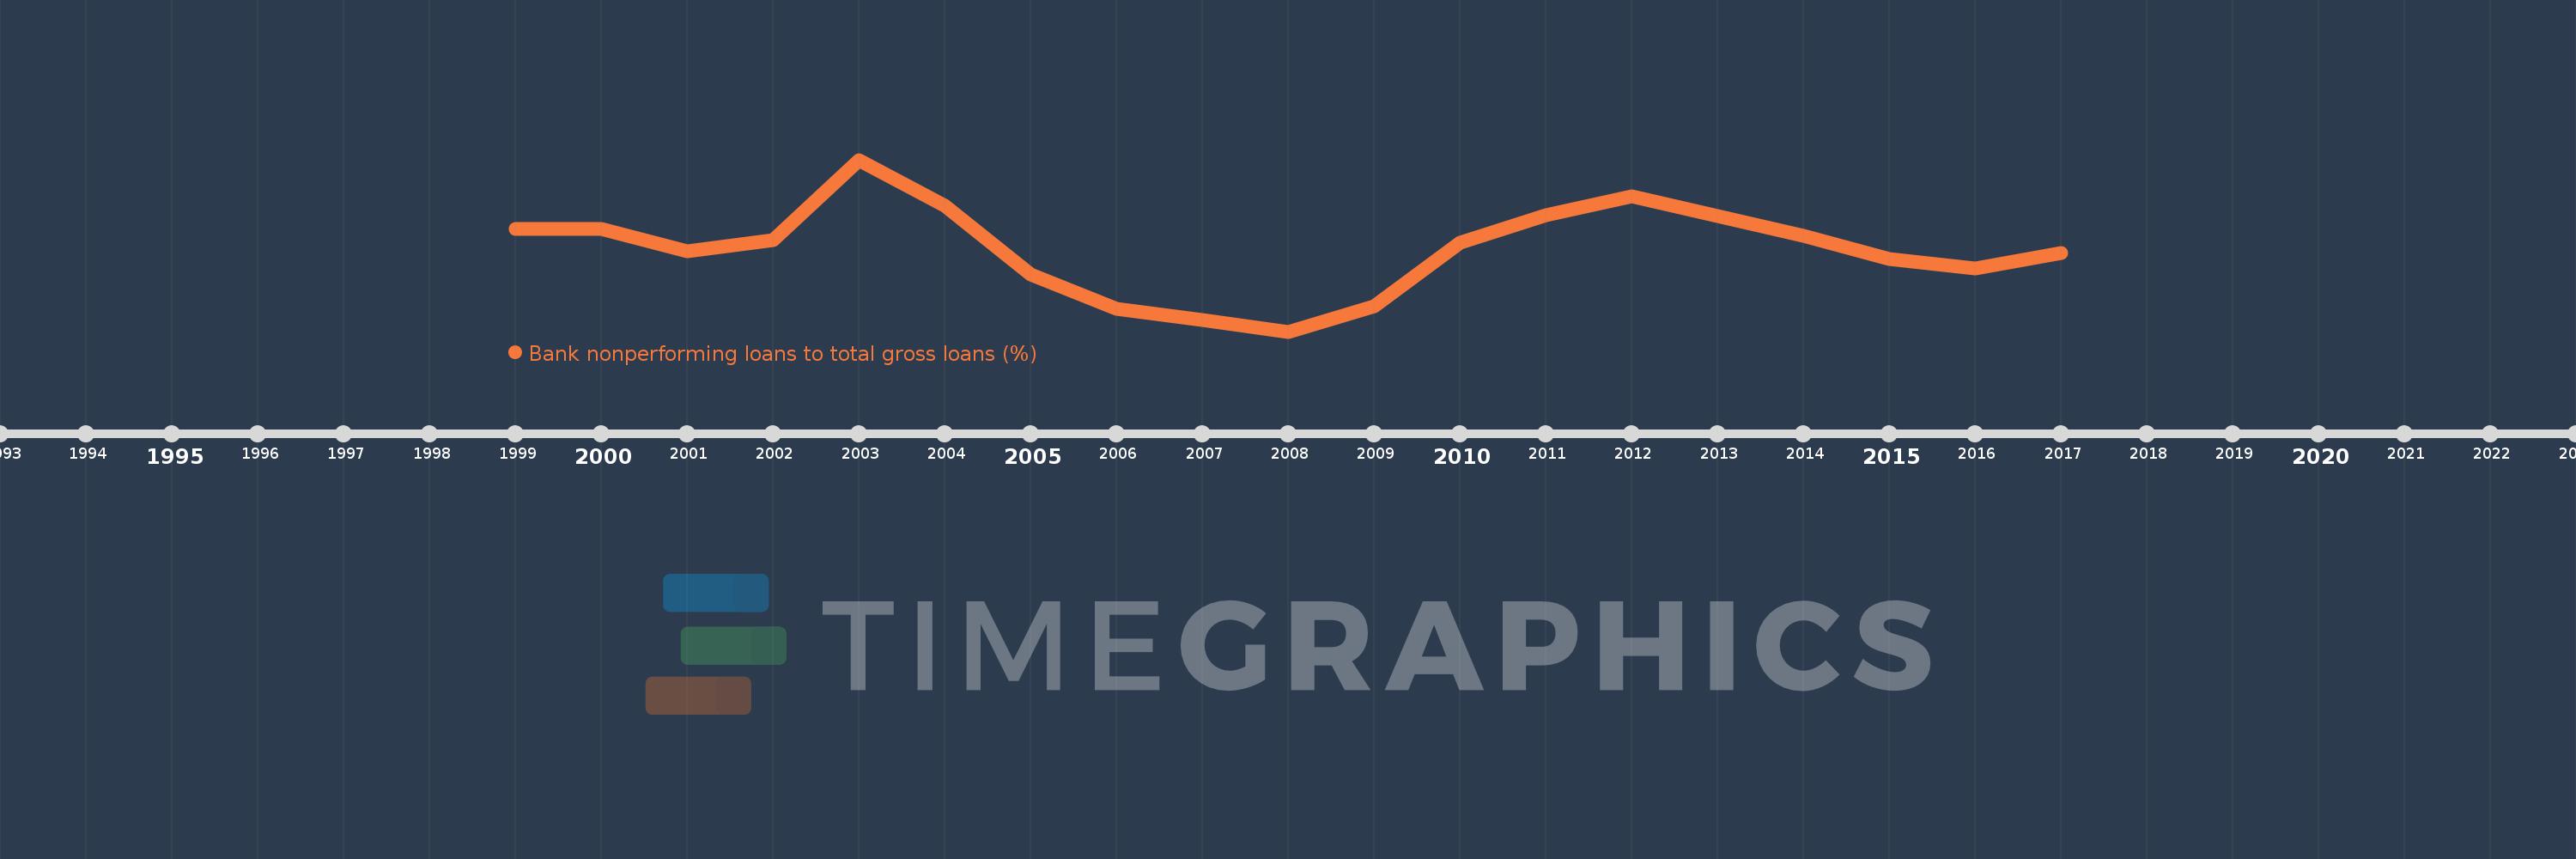
Bank nonperforming loans to total gross loans (%)
2017,2016,2015,2014,2013,2012,2011,2010,2009,2008,2007,2006,2005,2004,2003,2002,2001,2000,1999
This statistics in other country:
Timeline:
This timeline shows a graph from 1999 to 2017 of Norway. No data until 1998. Number of actual observations by date: 19.
Source name:
World Development Indicators
Source organization:
International Monetary Fund, Global Financial Stability Report.
Categories, topics:
Financial Sector
Last updated:
apr 23, 2017
Indicators value changes by year
At the date of observation
Value
Absolute change
Change from previous value
jan 1, 2001
1.2
-0.2
-14.29%
jan 1, 2002
1.3
+0.1
8.33%
jan 1, 2003
2.0
+0.7
53.85%
jan 1, 2004
1.6
-0.4
-20.0%
jan 1, 2005
1.0
-0.6
-37.5%
jan 1, 2006
0.7
-0.3
-30.0%
jan 1, 2007
0.6
-0.1
-14.29%
jan 1, 2008
0.5
-0.1
-16.67%
jan 1, 2009
0.723
+0.223
44.65%
jan 1, 2010
1.279
+0.555
76.8%
jan 1, 2011
1.52
+0.241
18.86%
jan 1, 2012
1.684
+0.165
10.83%
jan 1, 2013
1.512
-0.172
-10.22%
jan 1, 2014
1.339
-0.173
-11.47%
jan 1, 2015
1.131
-0.208
-15.53%
jan 1, 2016
1.053
-0.078
-6.85%
jan 1, 2017
1.186
+0.133
12.61%
Ranking of countries by current statistics by years


Comments: