29
/
en
AIzaSyAYiBZKx7MnpbEhh9jyipgxe19OcubqV5w
April 1, 2024
121795
Dominican Republic
DOM
true
2
1
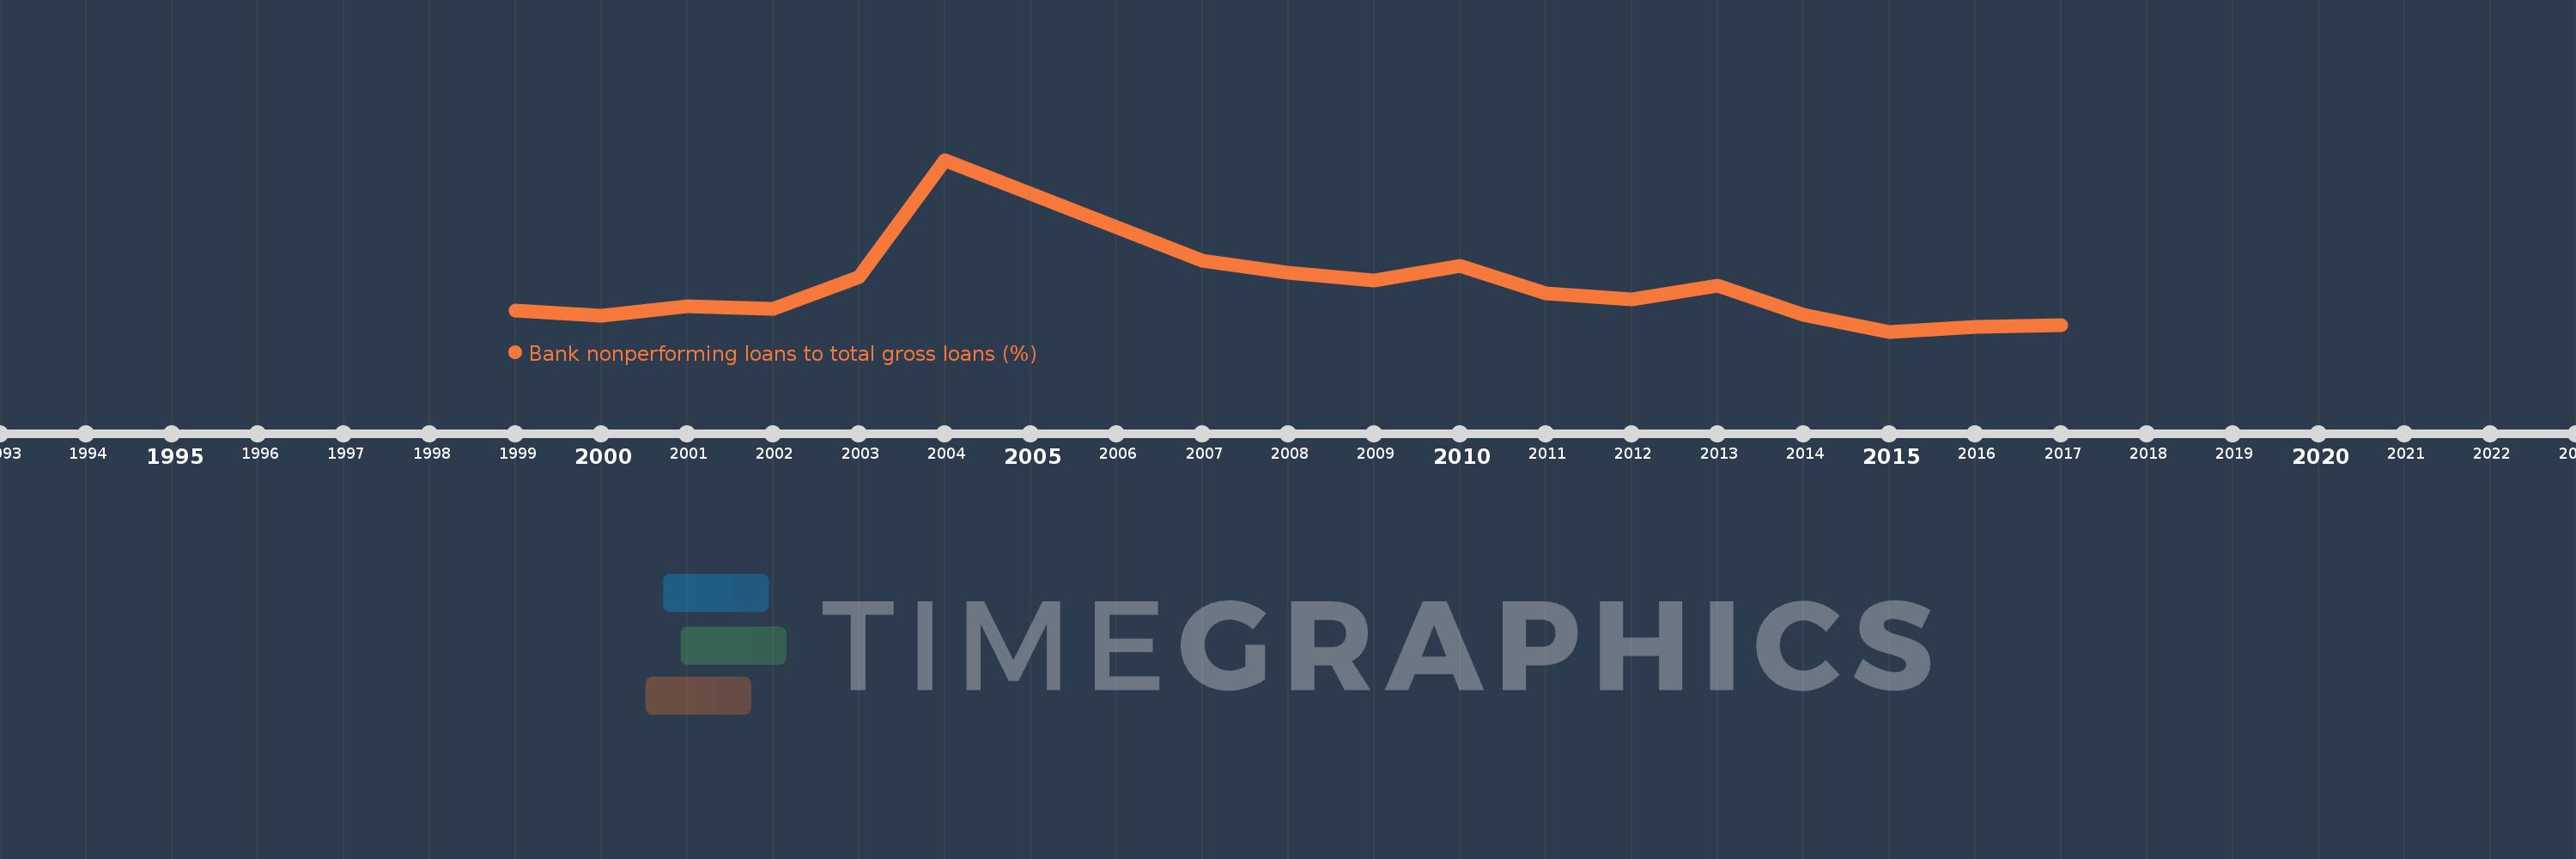
Bank nonperforming loans to total gross loans (%)
2017,2016,2015,2014,2013,2012,2011,2010,2009,2008,2007,2006,2005,2004,2003,2002,2001,2000,1999
This statistics in other country:
Timeline:
This timeline shows a graph from 1999 to 2017 of Dominican Republic. No data until 1998. Number of actual observations by date: 19.
Source name:
World Development Indicators
Source organization:
International Monetary Fund, Global Financial Stability Report.
Categories, topics:
Financial Sector
Last updated:
apr 23, 2017
Indicators value changes by year
At the date of observation
Value
Absolute change
Change from previous value
jan 1, 2000
2.2
-0.2
-8.33%
jan 1, 2001
2.6
+0.4
18.18%
jan 1, 2002
2.5
-0.1
-3.85%
jan 1, 2003
3.8
+1.3
52.0%
jan 1, 2004
8.7
+4.9
128.95%
jan 1, 2005
7.3
-1.4
-16.09%
jan 1, 2006
5.9
-1.4
-19.18%
jan 1, 2007
4.5
-1.4
-23.73%
jan 1, 2008
4.0
-0.5
-11.11%
jan 1, 2009
3.67
-0.33
-8.26%
jan 1, 2010
4.274
+0.604
16.47%
jan 1, 2011
3.129
-1.145
-26.79%
jan 1, 2012
2.871
-0.259
-8.26%
jan 1, 2013
3.455
+0.584
20.35%
jan 1, 2014
2.252
-1.203
-34.82%
jan 1, 2015
1.536
-0.715
-31.77%
jan 1, 2016
1.726
+0.189
12.33%
jan 1, 2017
1.81
+0.084
4.85%
Ranking of countries by current statistics by years


Comments: