29
/
en
AIzaSyAYiBZKx7MnpbEhh9jyipgxe19OcubqV5w
April 1, 2024
27893
East Asia & Pacific (excluding high income)
EAP
false
2
1
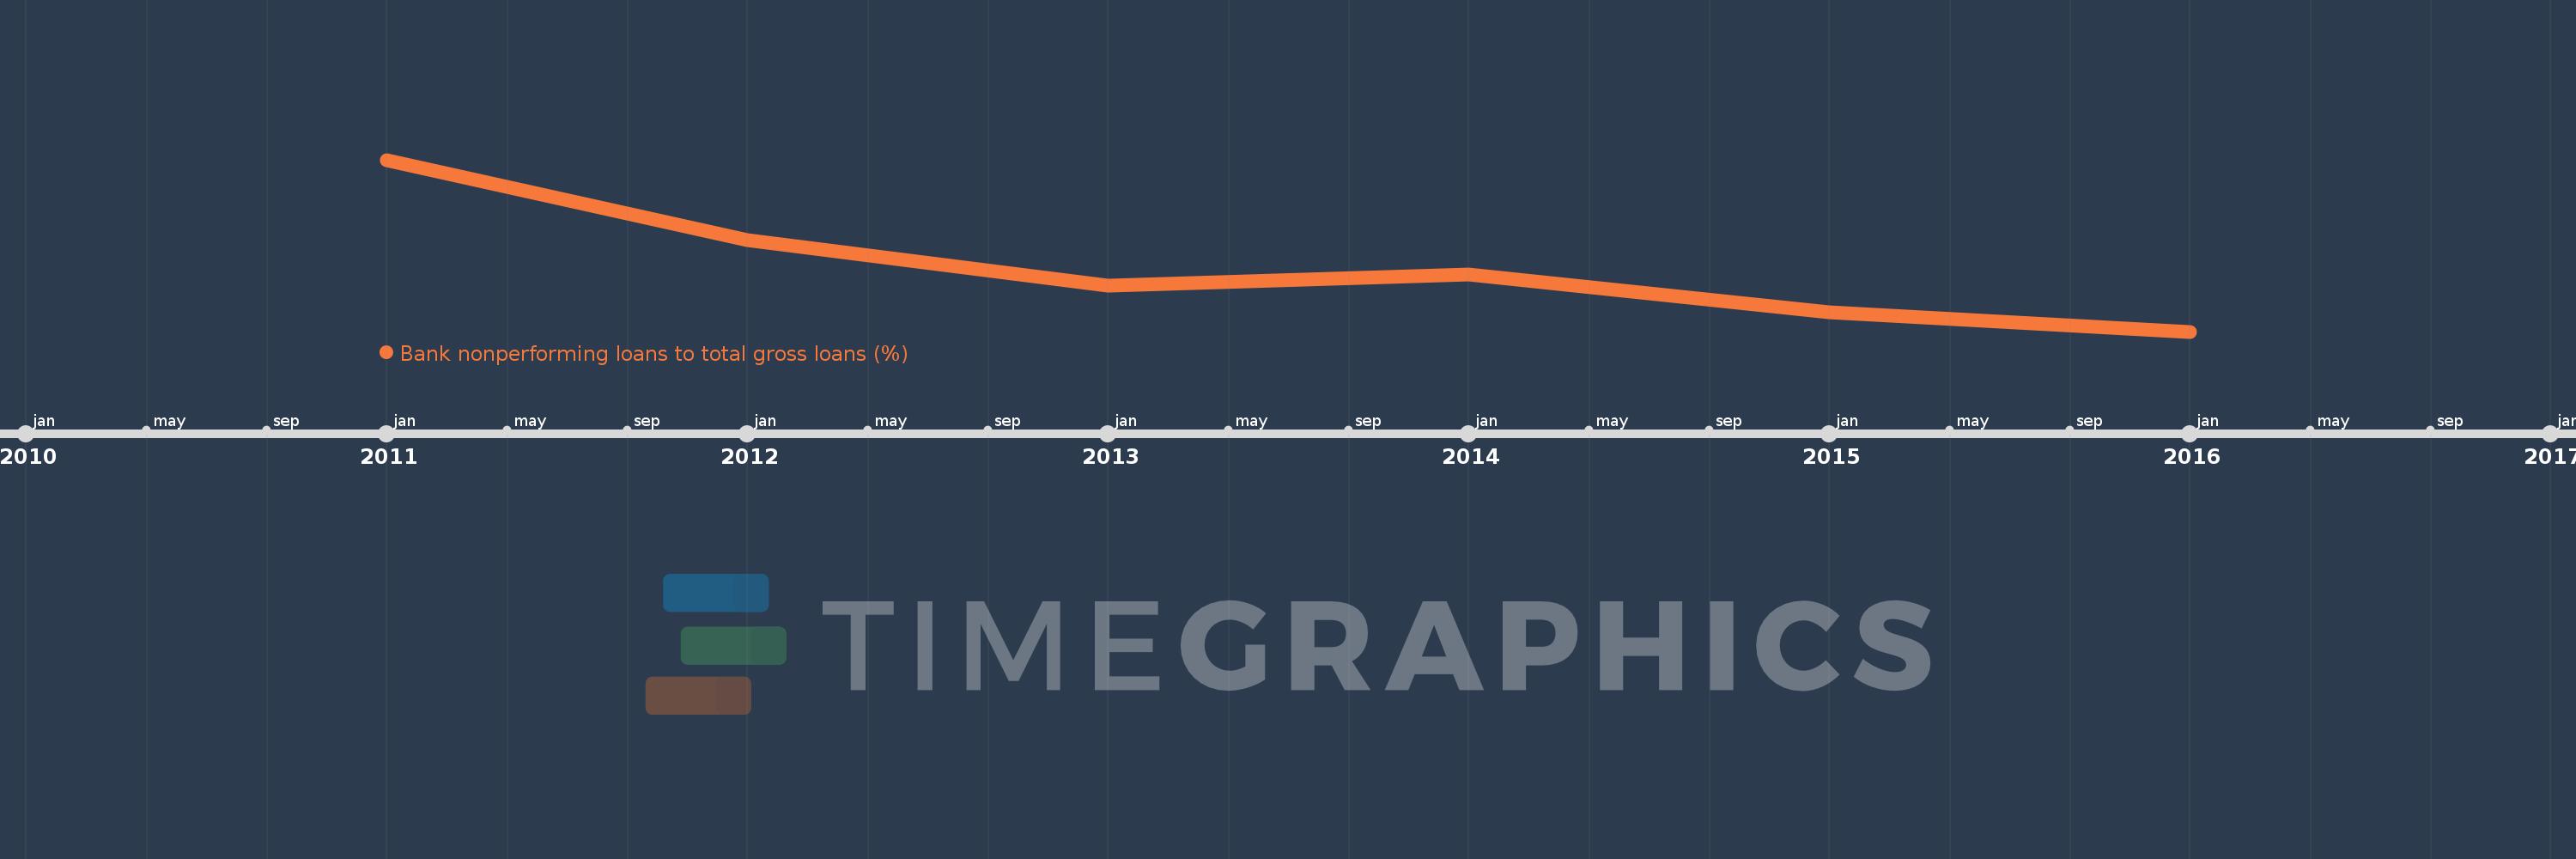
Bank nonperforming loans to total gross loans (%)
2016,2015,2014,2013,2012,2011
This statistics in other country:
Timeline:
This timeline shows a graph from 2011 to 2016 of East Asia & Pacific (excluding high income). No data until 2010. Number of actual observations by date: 6.
Source name:
World Development Indicators
Source organization:
International Monetary Fund, Global Financial Stability Report.
Categories, topics:
Financial Sector
Last updated:
apr 23, 2017
Indicators value changes by year
At the date of observation
Value
Absolute change
Change from previous value
jan 1, 2011
3.142
+3.142
0.0%
jan 1, 2012
2.555
-0.586
-18.66%
jan 1, 2013
2.223
-0.333
-13.01%
jan 1, 2014
2.303
+0.08
3.59%
jan 1, 2015
2.025
-0.278
-12.07%
jan 1, 2016
1.885
-0.139
-6.88%
Ranking of countries by current statistics by years


Comments: