29
/
en
AIzaSyAYiBZKx7MnpbEhh9jyipgxe19OcubqV5w
April 1, 2024
256083
Sweden
SWE
true
2
1
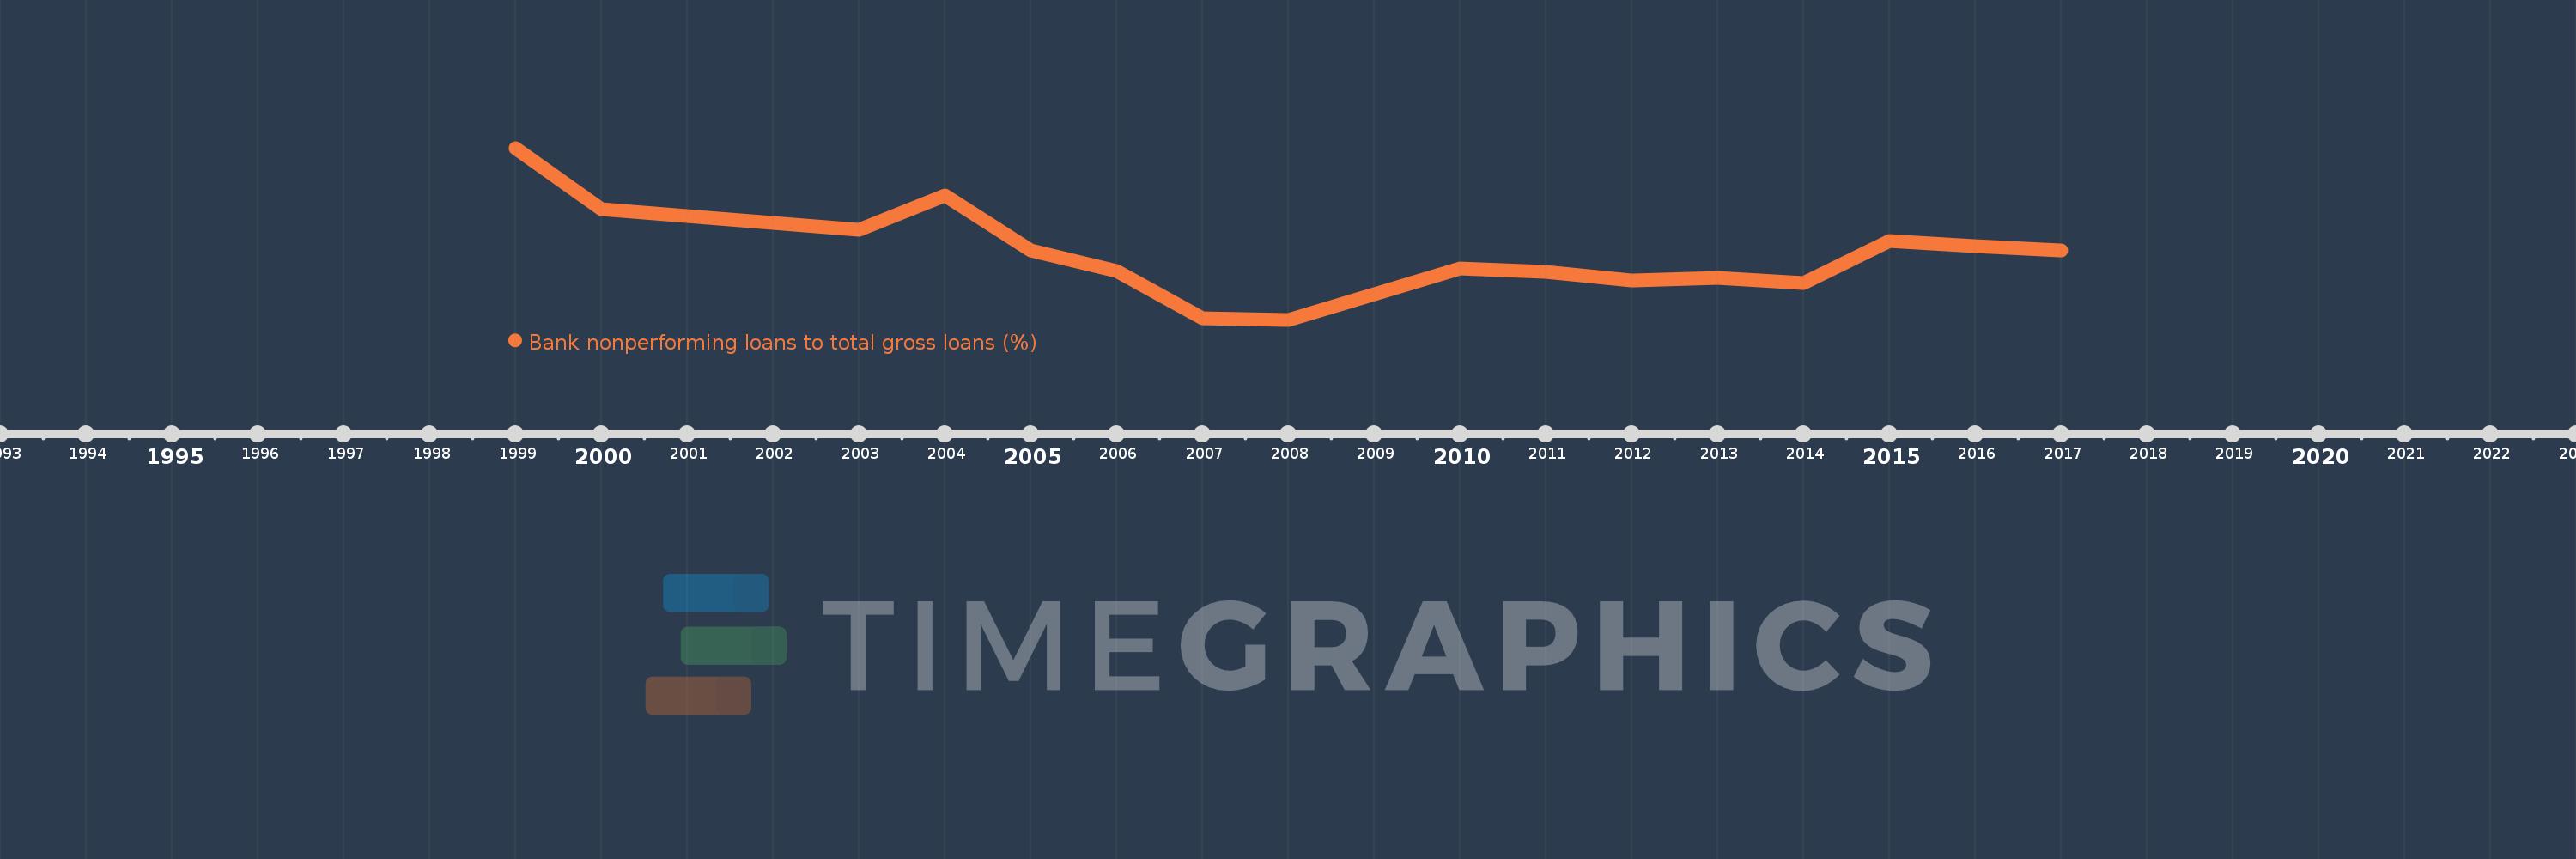
Bank nonperforming loans to total gross loans (%)
2017,2016,2015,2014,2013,2012,2011,2010,2009,2008,2007,2006,2005,2004,2003,2002,2001,2000,1999
This statistics in other country:
Timeline:
This timeline shows a graph from 1999 to 2017 of Sweden. No data until 1998. Number of actual observations by date: 19.
Source name:
World Development Indicators
Source organization:
International Monetary Fund, Global Financial Stability Report.
Categories, topics:
Financial Sector
Last updated:
apr 23, 2017
Indicators value changes by year
At the date of observation
Value
Absolute change
Change from previous value
jan 1, 2000
1.7
-0.9
-34.62%
jan 1, 2001
1.6
-0.1
-5.88%
jan 1, 2002
1.5
-0.1
-6.25%
jan 1, 2003
1.4
-0.1
-6.67%
jan 1, 2004
1.9
+0.5
35.71%
jan 1, 2005
1.1
-0.8
-42.11%
jan 1, 2006
0.8
-0.3
-27.27%
jan 1, 2007
0.105
-0.695
-86.88%
jan 1, 2008
0.082
-0.023
-21.9%
jan 1, 2009
0.462
+0.38
463.51%
jan 1, 2010
0.834
+0.372
80.52%
jan 1, 2011
0.784
-0.051
-6.06%
jan 1, 2012
0.654
-0.13
-16.53%
jan 1, 2013
0.7
+0.046
7.03%
jan 1, 2014
0.614
-0.086
-12.24%
jan 1, 2015
1.238
+0.624
101.56%
jan 1, 2016
1.165
-0.073
-5.92%
jan 1, 2017
1.1
-0.066
-5.63%
Ranking of countries by current statistics by years


Comments: