29
/
en
AIzaSyAYiBZKx7MnpbEhh9jyipgxe19OcubqV5w
April 1, 2024
172482
Kyrgyz Republic
KGZ
true
2
1
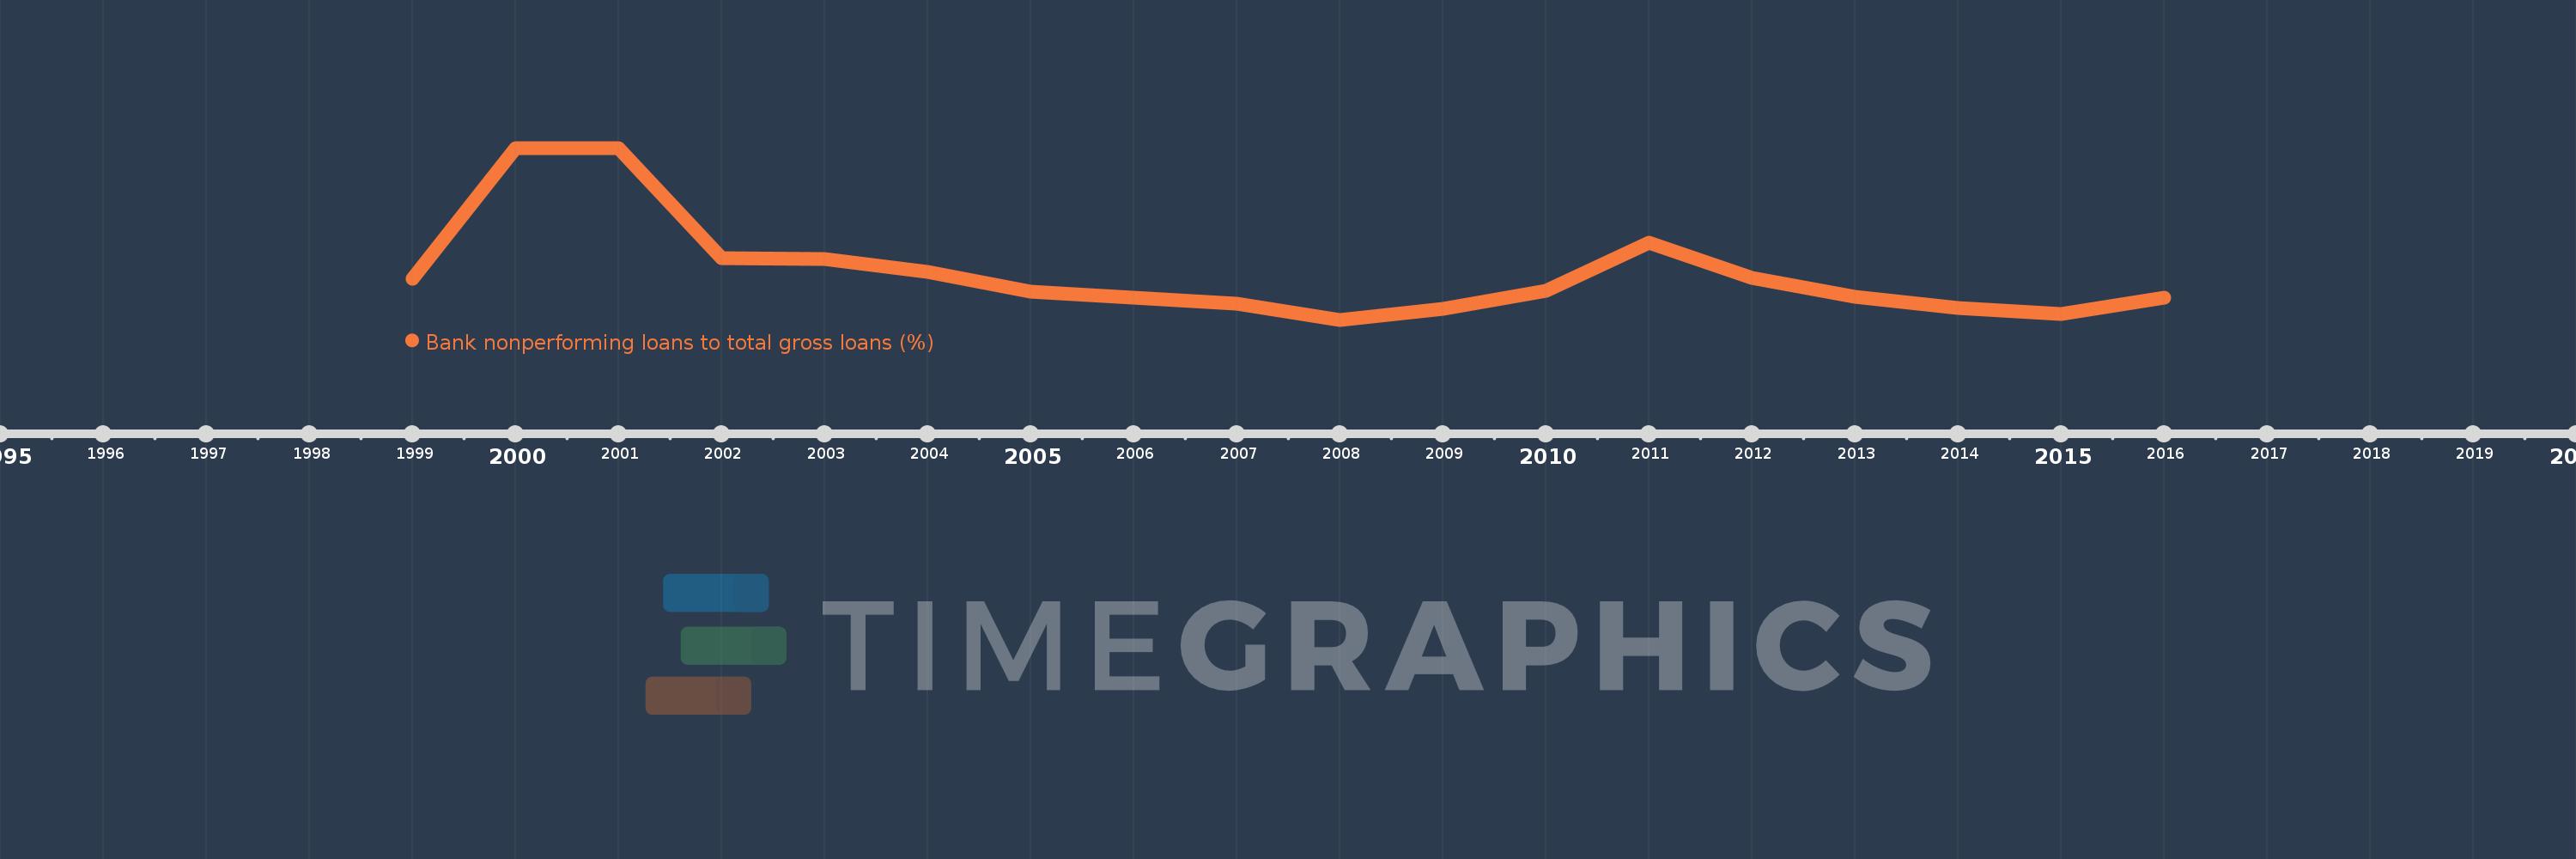
Bank nonperforming loans to total gross loans (%)
2016,2015,2014,2013,2012,2011,2010,2009,2008,2007,2005,2004,2003,2002,2001,2000,1999
This statistics in other country:
Timeline:
This timeline shows a graph from 1999 to 2016 of Kyrgyz Republic. No data until 1998. Number of actual observations by date: 17.
Source name:
World Development Indicators
Source organization:
International Monetary Fund, Global Financial Stability Report.
Categories, topics:
Financial Sector
Last updated:
apr 23, 2017
Indicators value changes by year
At the date of observation
Value
Absolute change
Change from previous value
jan 1, 1999
10.1
+10.1
0.0%
jan 1, 2000
30.9
+20.8
205.94%
jan 1, 2002
13.4
-17.5
-56.63%
jan 1, 2003
13.3
-0.1
-0.75%
jan 1, 2004
11.2
-2.1
-15.79%
jan 1, 2005
8.0
-3.2
-28.57%
jan 1, 2007
6.2
-1.8
-22.5%
jan 1, 2008
3.6
-2.6
-41.94%
jan 1, 2009
5.3
+1.7
47.22%
jan 1, 2010
8.2
+2.9
54.72%
jan 1, 2011
15.8
+7.6
92.68%
jan 1, 2012
10.2
-5.6
-35.44%
jan 1, 2013
7.2
-3.0
-29.41%
jan 1, 2014
5.5
-1.7
-23.61%
jan 1, 2015
4.5
-1.0
-18.18%
jan 1, 2016
7.1
+2.6
57.78%
Ranking of countries by current statistics by years


Comments: