29
/
en
AIzaSyAYiBZKx7MnpbEhh9jyipgxe19OcubqV5w
April 1, 2024
160241
Israel
ISR
true
2
1
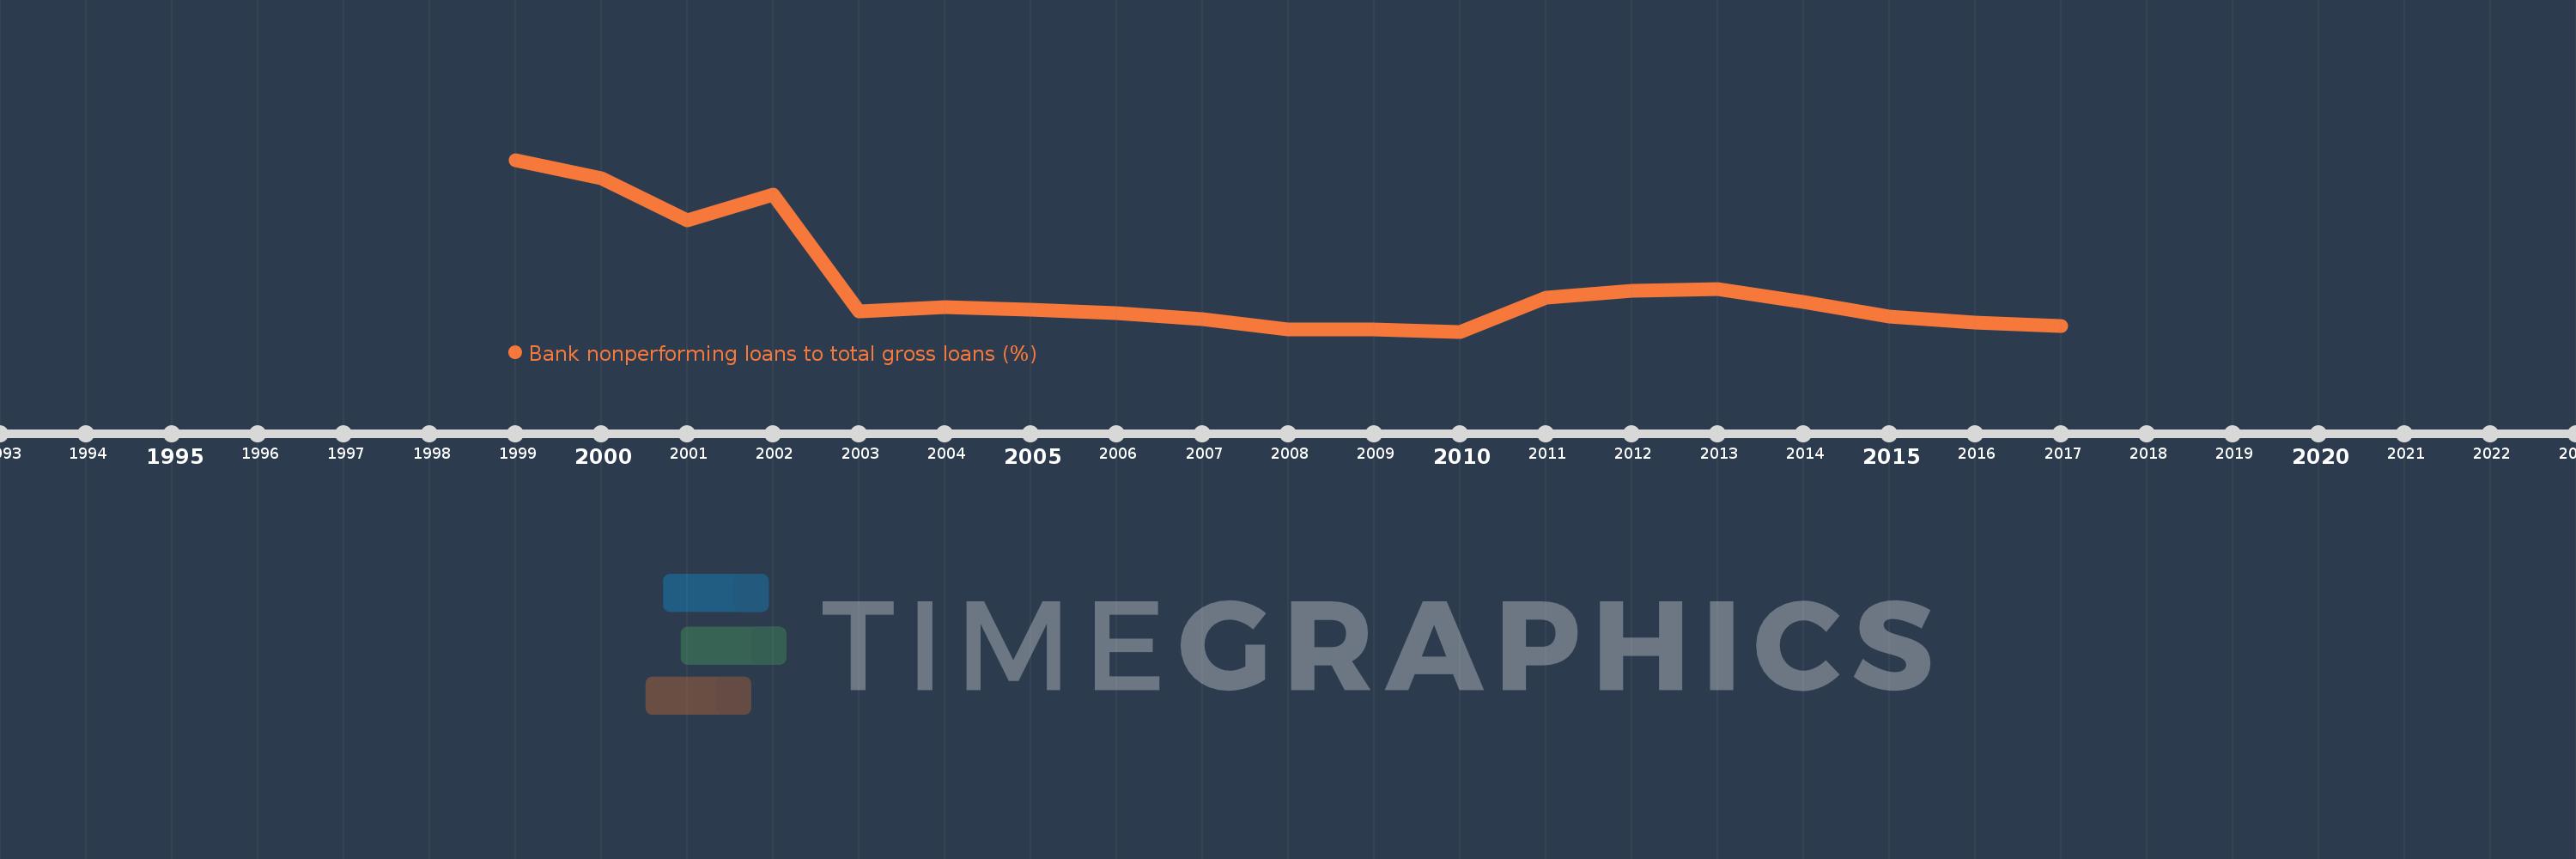
Bank nonperforming loans to total gross loans (%)
2017,2016,2015,2014,2013,2012,2011,2010,2009,2008,2007,2006,2005,2004,2003,2002,2001,2000,1999
This statistics in other country:
Timeline:
This timeline shows a graph from 1999 to 2017 of Israel. No data until 1998. Number of actual observations by date: 19.
Source name:
World Development Indicators
Source organization:
International Monetary Fund, Global Financial Stability Report.
Categories, topics:
Financial Sector
Last updated:
apr 23, 2017
Indicators value changes by year
At the date of observation
Value
Absolute change
Change from previous value
jan 1, 2000
9.0
-0.9
-9.09%
jan 1, 2001
6.9
-2.1
-23.33%
jan 1, 2002
8.2
+1.3
18.84%
jan 1, 2003
2.4
-5.8
-70.73%
jan 1, 2004
2.6
+0.2
8.33%
jan 1, 2005
2.5
-0.1
-3.85%
jan 1, 2006
2.3
-0.2
-8.0%
jan 1, 2007
2.0
-0.3
-13.04%
jan 1, 2008
1.5
-0.5
-25.0%
jan 1, 2010
1.4
-0.1
-6.67%
jan 1, 2011
3.1
+1.7
121.43%
jan 1, 2012
3.419
+0.319
10.29%
jan 1, 2013
3.501
+0.082
2.4%
jan 1, 2014
2.861
-0.64
-18.29%
jan 1, 2015
2.151
-0.71
-24.81%
jan 1, 2016
1.845
-0.306
-14.24%
jan 1, 2017
1.677
-0.168
-9.08%
Ranking of countries by current statistics by years


Comments: