29
/
en
AIzaSyAYiBZKx7MnpbEhh9jyipgxe19OcubqV5w
April 1, 2024
87543
Bolivia
BOL
true
2
1
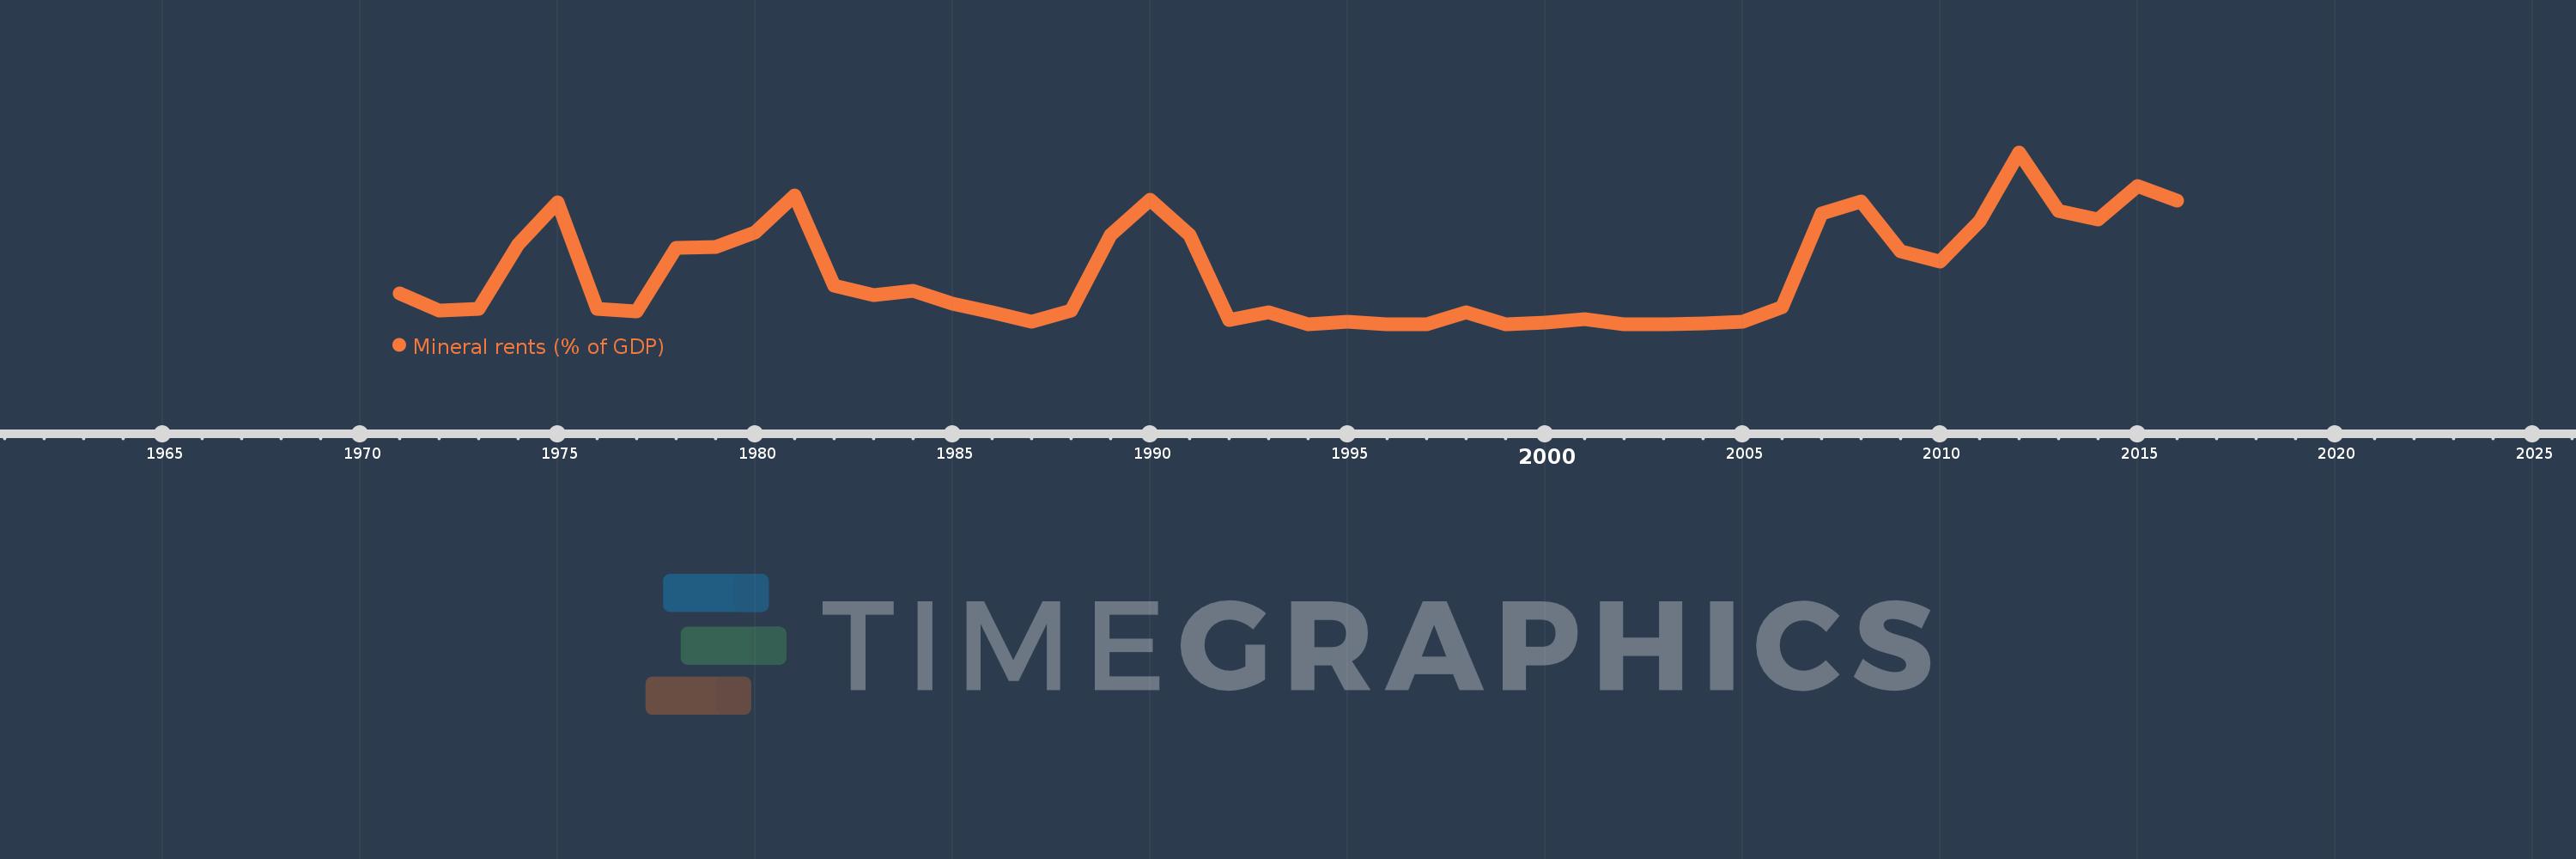
Mineral rents (% of GDP)
2016,2015,2014,2013,2012,2011,2010,2009,2008,2007,2006,2005,2004,2003,2002,2001,2000,1999,1998,1997,1996,1995,1994,1993,1992,1991,1990,1989,1988,1987,1986,1985,1984,1983,1982,1981,1980,1979,1978,1977,1976,1975,1974,1973,1972,1971
This statistics in other country:
AfghanistanAlbaniaAlgeriaAndorraAngolaAntigua and BarbudaArab WorldArgentinaArmeniaArubaAustraliaAustriaAzerbaijanBahamas, TheBahrainBangladeshBarbadosBelarusBelgiumBelizeBeninBermudaBhutanBoliviaBosnia and HerzegovinaBotswanaBrazilBrunei DarussalamBulgariaBurkina FasoBurundiCabo VerdeCambodiaCameroonCanadaCaribbean small statesCayman IslandsCentral African RepublicCentral Europe and the BalticsChadChannel IslandsChileChinaColombiaComorosCongo, Dem. Rep.Congo, Rep.Costa RicaCote d'IvoireCroatiaCubaCyprusCzech RepublicDenmarkDjiboutiDominicaDominican RepublicEarly-demographic dividendEast Asia & PacificEast Asia & Pacific (excluding high income)East Asia & Pacific (IDA & IBRD countries)EcuadorEgypt, Arab Rep.El SalvadorEquatorial GuineaEritreaEstoniaEthiopiaEuro areaEurope & Central AsiaEurope & Central Asia (excluding high income)Europe & Central Asia (IDA & IBRD countries)European UnionFaroe IslandsFijiFinlandFragile and conflict affected situationsFranceFrench PolynesiaGabonGambia, TheGeorgiaGermanyGhanaGreeceGreenlandGrenadaGuatemalaGuineaGuinea-BissauGuyanaHaitiHeavily indebted poor countries (HIPC)High incomeHondurasHong Kong SAR, ChinaHungaryIBRD onlyIcelandIDA & IBRD totalIDA blendIDA onlyIDA totalIndiaIndonesiaIran, Islamic Rep.IraqIrelandIsle of ManIsraelItalyJamaicaJapanJordanKazakhstanKenyaKiribatiKorea, Rep.KosovoKuwaitKyrgyz RepublicLao PDRLate-demographic dividendLatin America & Caribbean Latin America & Caribbean (excluding high income)Latin America & the Caribbean (IDA & IBRD countries)LatviaLeast developed countries: UN classificationLebanonLesothoLiberiaLibyaLiechtensteinLithuaniaLow & middle incomeLow incomeLower middle incomeLuxembourgMacao SAR, ChinaMacedonia, FYRMadagascarMalawiMalaysiaMaldivesMaliMaltaMarshall IslandsMauritaniaMauritiusMexicoMicronesia, Fed. Sts.Middle East & North AfricaMiddle East & North Africa (excluding high income)Middle East & North Africa (IDA & IBRD countries)Middle incomeMoldovaMonacoMongoliaMontenegroMoroccoMozambiqueMyanmarNamibiaNepalNetherlandsNew CaledoniaNew ZealandNicaraguaNigerNigeriaNorth AmericaNorwayOECD membersOmanOther small statesPacific island small statesPakistanPalauPanamaPapua New GuineaParaguayPeruPhilippinesPolandPortugalPost-demographic dividendPre-demographic dividendPuerto RicoQatarRomaniaRussian FederationRwandaSamoaSan MarinoSao Tome and PrincipeSaudi ArabiaSenegalSerbiaSeychellesSierra LeoneSingaporeSlovak RepublicSloveniaSmall statesSolomon IslandsSomaliaSouth AfricaSouth AsiaSouth Asia (IDA & IBRD)South SudanSpainSri LankaSt. Kitts and NevisSt. LuciaSt. Vincent and the GrenadinesSub-Saharan Africa Sub-Saharan Africa (excluding high income)Sub-Saharan Africa (IDA & IBRD countries)SudanSurinameSwazilandSwedenSwitzerlandSyrian Arab RepublicTajikistanTanzaniaThailandTimor-LesteTogoTongaTrinidad and TobagoTunisiaTurkeyTurkmenistanTuvaluUgandaUkraineUnited Arab EmiratesUnited KingdomUnited StatesUpper middle incomeUruguayUzbekistanVanuatuVenezuela, RBVietnamVirgin Islands (U.S.)West Bank and GazaWorldYemen, Rep.ZambiaZimbabwe Timeline:
This timeline shows a graph from 1971 to 2016 of Bolivia. No data until 1970. Number of actual observations by date: 46.
Source name:
World Development Indicators
Source organization:
Estimates based on sources and methods described in "The Changing Wealth of Nations: Measuring Sustainable Development in the New Millennium" (World Bank, 2011).
Categories, topics:
Energy & Mining, Environment
Last updated:
apr 23, 2017
Indicators value changes by year
At the date of observation
Value
Absolute change
Change from previous value
jan 1, 1971
1.051
+1.051
0.0%
jan 1, 1972
0.47
-0.581
-55.3%
jan 1, 1973
0.528
+0.058
12.41%
jan 1, 1974
2.713
+2.185
413.79%
jan 1, 1975
4.146
+1.432
52.78%
jan 1, 1976
0.531
-3.615
-87.19%
jan 1, 1977
0.431
-0.1
-18.79%
jan 1, 1978
2.617
+2.186
507.01%
jan 1, 1979
2.627
+0.01
0.37%
jan 1, 1980
3.135
+0.508
19.35%
jan 1, 1981
4.403
+1.268
40.44%
jan 1, 1982
1.312
-3.091
-70.19%
jan 1, 1983
0.988
-0.325
-24.75%
jan 1, 1984
1.138
+0.15
15.19%
jan 1, 1985
0.708
-0.43
-37.78%
jan 1, 1986
0.405
-0.302
-42.71%
jan 1, 1987
0.078
-0.328
-80.78%
jan 1, 1988
0.468
+0.39
500.05%
jan 1, 1989
3.048
+2.58
551.74%
jan 1, 1990
4.251
+1.204
39.5%
jan 1, 1991
3.042
-1.21
-28.45%
jan 1, 1992
0.156
-2.886
-94.87%
jan 1, 1993
0.416
+0.26
166.37%
jan 1, 1994
0.011
-0.405
-97.4%
jan 1, 1995
0.076
+0.065
601.94%
jan 1, 1996
0.01
-0.066
-86.83%
jan 1, 1997
0.009
-0.001
-7.45%
jan 1, 1998
0.402
+0.393
4.25K%
jan 1, 1999
0.0
-0.402
-100.0%
jan 1, 2000
0.056
+0.056
%
jan 1, 2001
0.17
+0.114
203.97%
jan 1, 2002
0.0
-0.17
-100.0%
jan 1, 2004
0.028
+0.028
%
jan 1, 2005
0.095
+0.067
234.4%
jan 1, 2006
0.584
+0.489
514.97%
jan 1, 2007
3.786
+3.202
548.79%
jan 1, 2008
4.175
+0.389
10.27%
jan 1, 2009
2.499
-1.676
-40.14%
jan 1, 2010
2.143
-0.356
-14.25%
jan 1, 2011
3.526
+1.383
64.55%
jan 1, 2012
5.863
+2.337
66.27%
jan 1, 2013
3.855
-2.008
-34.25%
jan 1, 2014
3.57
-0.285
-7.39%
jan 1, 2015
4.709
+1.139
31.91%
jan 1, 2016
4.21
-0.498
-10.58%
Ranking of countries by current statistics by years


Comments: