29
/
en
AIzaSyAYiBZKx7MnpbEhh9jyipgxe19OcubqV5w
April 1, 2024
150690
Honduras
HND
true
2
1
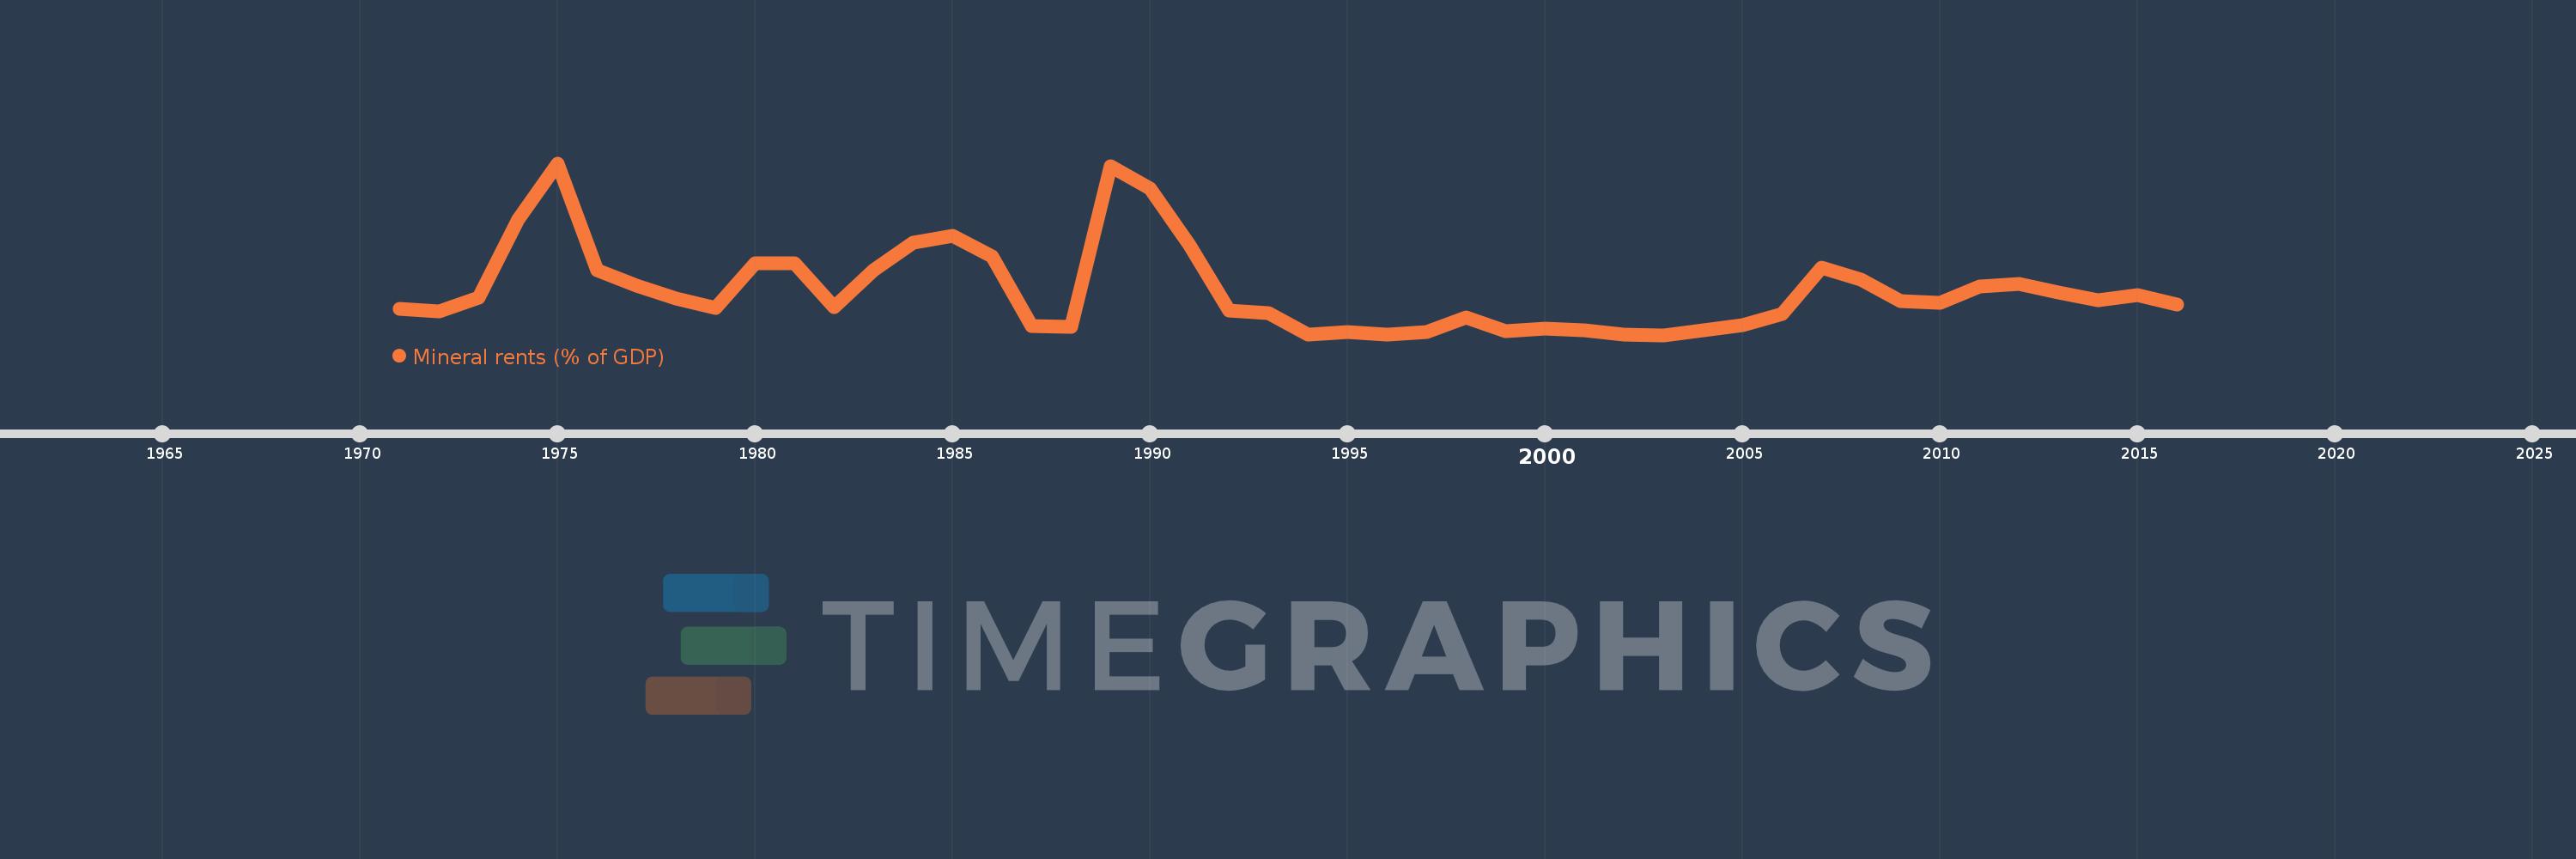
Mineral rents (% of GDP)
2016,2015,2014,2013,2012,2011,2010,2009,2008,2007,2006,2005,2004,2003,2002,2001,2000,1999,1998,1997,1996,1995,1994,1993,1992,1991,1990,1989,1988,1987,1986,1985,1984,1983,1982,1981,1980,1979,1978,1977,1976,1975,1974,1973,1972,1971
This statistics in other country:
AfghanistanAlbaniaAlgeriaAndorraAngolaAntigua and BarbudaArab WorldArgentinaArmeniaArubaAustraliaAustriaAzerbaijanBahamas, TheBahrainBangladeshBarbadosBelarusBelgiumBelizeBeninBermudaBhutanBoliviaBosnia and HerzegovinaBotswanaBrazilBrunei DarussalamBulgariaBurkina FasoBurundiCabo VerdeCambodiaCameroonCanadaCaribbean small statesCayman IslandsCentral African RepublicCentral Europe and the BalticsChadChannel IslandsChileChinaColombiaComorosCongo, Dem. Rep.Congo, Rep.Costa RicaCote d'IvoireCroatiaCubaCyprusCzech RepublicDenmarkDjiboutiDominicaDominican RepublicEarly-demographic dividendEast Asia & PacificEast Asia & Pacific (excluding high income)East Asia & Pacific (IDA & IBRD countries)EcuadorEgypt, Arab Rep.El SalvadorEquatorial GuineaEritreaEstoniaEthiopiaEuro areaEurope & Central AsiaEurope & Central Asia (excluding high income)Europe & Central Asia (IDA & IBRD countries)European UnionFaroe IslandsFijiFinlandFragile and conflict affected situationsFranceFrench PolynesiaGabonGambia, TheGeorgiaGermanyGhanaGreeceGreenlandGrenadaGuatemalaGuineaGuinea-BissauGuyanaHaitiHeavily indebted poor countries (HIPC)High incomeHondurasHong Kong SAR, ChinaHungaryIBRD onlyIcelandIDA & IBRD totalIDA blendIDA onlyIDA totalIndiaIndonesiaIran, Islamic Rep.IraqIrelandIsle of ManIsraelItalyJamaicaJapanJordanKazakhstanKenyaKiribatiKorea, Rep.KosovoKuwaitKyrgyz RepublicLao PDRLate-demographic dividendLatin America & Caribbean Latin America & Caribbean (excluding high income)Latin America & the Caribbean (IDA & IBRD countries)LatviaLeast developed countries: UN classificationLebanonLesothoLiberiaLibyaLiechtensteinLithuaniaLow & middle incomeLow incomeLower middle incomeLuxembourgMacao SAR, ChinaMacedonia, FYRMadagascarMalawiMalaysiaMaldivesMaliMaltaMarshall IslandsMauritaniaMauritiusMexicoMicronesia, Fed. Sts.Middle East & North AfricaMiddle East & North Africa (excluding high income)Middle East & North Africa (IDA & IBRD countries)Middle incomeMoldovaMonacoMongoliaMontenegroMoroccoMozambiqueMyanmarNamibiaNepalNetherlandsNew CaledoniaNew ZealandNicaraguaNigerNigeriaNorth AmericaNorwayOECD membersOmanOther small statesPacific island small statesPakistanPalauPanamaPapua New GuineaParaguayPeruPhilippinesPolandPortugalPost-demographic dividendPre-demographic dividendPuerto RicoQatarRomaniaRussian FederationRwandaSamoaSan MarinoSao Tome and PrincipeSaudi ArabiaSenegalSerbiaSeychellesSierra LeoneSingaporeSlovak RepublicSloveniaSmall statesSolomon IslandsSomaliaSouth AfricaSouth AsiaSouth Asia (IDA & IBRD)South SudanSpainSri LankaSt. Kitts and NevisSt. LuciaSt. Vincent and the GrenadinesSub-Saharan Africa Sub-Saharan Africa (excluding high income)Sub-Saharan Africa (IDA & IBRD countries)SudanSurinameSwazilandSwedenSwitzerlandSyrian Arab RepublicTajikistanTanzaniaThailandTimor-LesteTogoTongaTrinidad and TobagoTunisiaTurkeyTurkmenistanTuvaluUgandaUkraineUnited Arab EmiratesUnited KingdomUnited StatesUpper middle incomeUruguayUzbekistanVanuatuVenezuela, RBVietnamVirgin Islands (U.S.)West Bank and GazaWorldYemen, Rep.ZambiaZimbabwe Timeline:
This timeline shows a graph from 1971 to 2016 of Honduras. No data until 1970. Number of actual observations by date: 46.
Source name:
World Development Indicators
Source organization:
Estimates based on sources and methods described in "The Changing Wealth of Nations: Measuring Sustainable Development in the New Millennium" (World Bank, 2011).
Categories, topics:
Energy & Mining, Environment
Last updated:
apr 23, 2017
Indicators value changes by year
At the date of observation
Value
Absolute change
Change from previous value
jan 1, 1971
0.527
+0.527
0.0%
jan 1, 1972
0.468
-0.059
-11.19%
jan 1, 1973
0.716
+0.248
53.02%
jan 1, 1974
2.121
+1.405
196.36%
jan 1, 1975
3.126
+1.005
47.38%
jan 1, 1976
1.21
-1.916
-61.3%
jan 1, 1977
0.932
-0.278
-22.97%
jan 1, 1978
0.71
-0.222
-23.78%
jan 1, 1979
0.536
-0.174
-24.55%
jan 1, 1980
1.34
+0.804
149.99%
jan 1, 1981
1.333
-0.006
-0.46%
jan 1, 1982
0.557
-0.776
-58.23%
jan 1, 1983
1.22
+0.663
119.04%
jan 1, 1984
1.711
+0.491
40.24%
jan 1, 1985
1.835
+0.124
7.22%
jan 1, 1986
1.466
-0.368
-20.07%
jan 1, 1987
0.215
-1.252
-85.35%
jan 1, 1988
0.193
-0.022
-10.1%
jan 1, 1989
3.075
+2.881
1.49K%
jan 1, 1990
2.675
-0.4
-12.99%
jan 1, 1991
1.659
-1.016
-37.99%
jan 1, 1992
0.494
-1.165
-70.23%
jan 1, 1993
0.44
-0.053
-10.82%
jan 1, 1994
0.061
-0.379
-86.1%
jan 1, 1995
0.109
+0.048
78.56%
jan 1, 1996
0.059
-0.051
-46.24%
jan 1, 1997
0.113
+0.054
91.97%
jan 1, 1998
0.374
+0.261
231.69%
jan 1, 1999
0.122
-0.252
-67.29%
jan 1, 2000
0.163
+0.04
32.88%
jan 1, 2001
0.132
-0.031
-18.97%
jan 1, 2002
0.06
-0.072
-54.72%
jan 1, 2003
0.053
-0.007
-11.18%
jan 1, 2004
0.131
+0.078
147.58%
jan 1, 2005
0.234
+0.103
78.56%
jan 1, 2006
0.425
+0.19
81.12%
jan 1, 2007
1.262
+0.837
197.23%
jan 1, 2008
1.049
-0.213
-16.85%
jan 1, 2009
0.661
-0.388
-36.97%
jan 1, 2010
0.636
-0.026
-3.88%
jan 1, 2011
0.917
+0.281
44.25%
jan 1, 2012
0.97
+0.054
5.84%
jan 1, 2013
0.81
-0.16
-16.5%
jan 1, 2014
0.679
-0.131
-16.2%
jan 1, 2015
0.765
+0.086
12.68%
jan 1, 2016
0.601
-0.164
-21.49%
Ranking of countries by current statistics by years


Comments: