29
/
en
AIzaSyAYiBZKx7MnpbEhh9jyipgxe19OcubqV5w
April 1, 2024
39215
IDA only
IDX
false
2
1
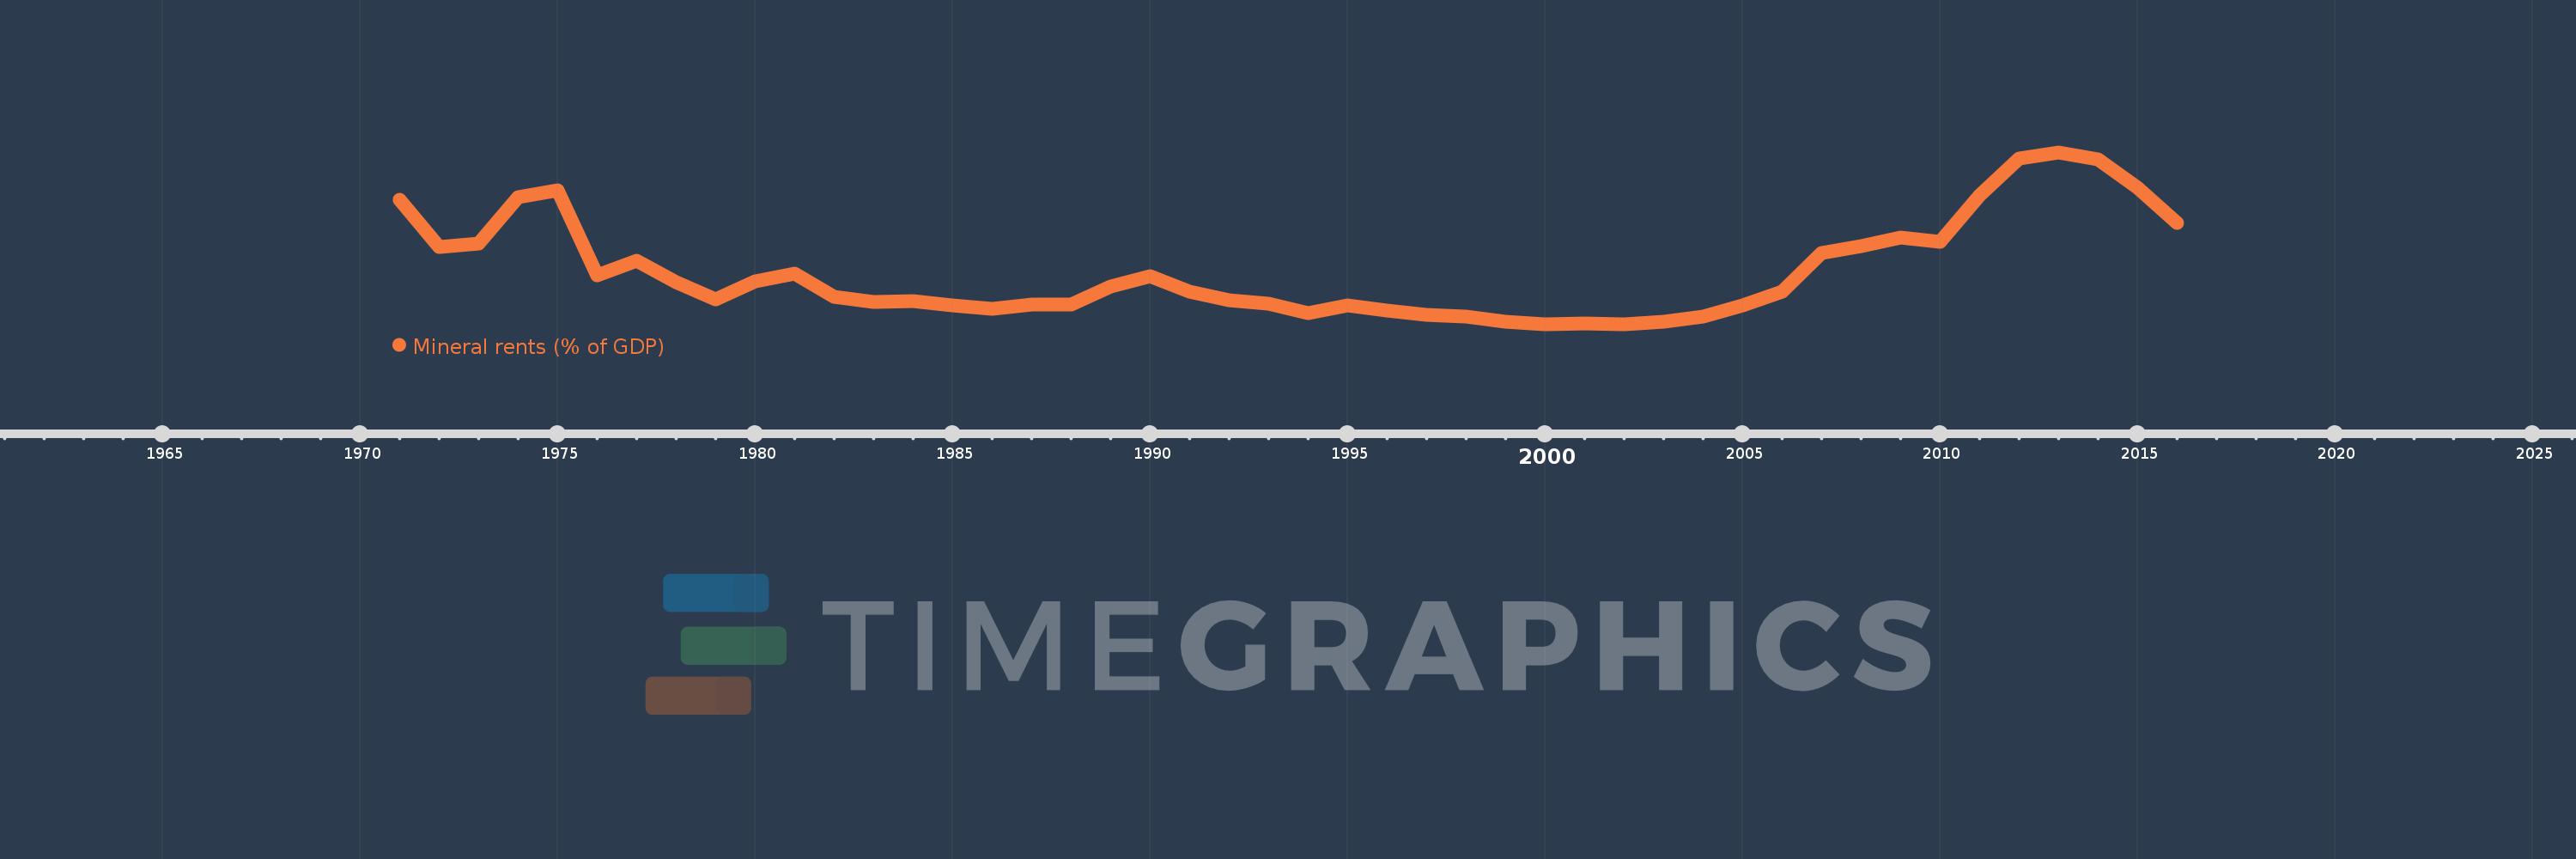
Mineral rents (% of GDP)
2016,2015,2014,2013,2012,2011,2010,2009,2008,2007,2006,2005,2004,2003,2002,2001,2000,1999,1998,1997,1996,1995,1994,1993,1992,1991,1990,1989,1988,1987,1986,1985,1984,1983,1982,1981,1980,1979,1978,1977,1976,1975,1974,1973,1972,1971
This statistics in other country:
AfghanistanAlbaniaAlgeriaAndorraAngolaAntigua and BarbudaArab WorldArgentinaArmeniaArubaAustraliaAustriaAzerbaijanBahamas, TheBahrainBangladeshBarbadosBelarusBelgiumBelizeBeninBermudaBhutanBoliviaBosnia and HerzegovinaBotswanaBrazilBrunei DarussalamBulgariaBurkina FasoBurundiCabo VerdeCambodiaCameroonCanadaCaribbean small statesCayman IslandsCentral African RepublicCentral Europe and the BalticsChadChannel IslandsChileChinaColombiaComorosCongo, Dem. Rep.Congo, Rep.Costa RicaCote d'IvoireCroatiaCubaCyprusCzech RepublicDenmarkDjiboutiDominicaDominican RepublicEarly-demographic dividendEast Asia & PacificEast Asia & Pacific (excluding high income)East Asia & Pacific (IDA & IBRD countries)EcuadorEgypt, Arab Rep.El SalvadorEquatorial GuineaEritreaEstoniaEthiopiaEuro areaEurope & Central AsiaEurope & Central Asia (excluding high income)Europe & Central Asia (IDA & IBRD countries)European UnionFaroe IslandsFijiFinlandFragile and conflict affected situationsFranceFrench PolynesiaGabonGambia, TheGeorgiaGermanyGhanaGreeceGreenlandGrenadaGuatemalaGuineaGuinea-BissauGuyanaHaitiHeavily indebted poor countries (HIPC)High incomeHondurasHong Kong SAR, ChinaHungaryIBRD onlyIcelandIDA & IBRD totalIDA blendIDA onlyIDA totalIndiaIndonesiaIran, Islamic Rep.IraqIrelandIsle of ManIsraelItalyJamaicaJapanJordanKazakhstanKenyaKiribatiKorea, Rep.KosovoKuwaitKyrgyz RepublicLao PDRLate-demographic dividendLatin America & Caribbean Latin America & Caribbean (excluding high income)Latin America & the Caribbean (IDA & IBRD countries)LatviaLeast developed countries: UN classificationLebanonLesothoLiberiaLibyaLiechtensteinLithuaniaLow & middle incomeLow incomeLower middle incomeLuxembourgMacao SAR, ChinaMacedonia, FYRMadagascarMalawiMalaysiaMaldivesMaliMaltaMarshall IslandsMauritaniaMauritiusMexicoMicronesia, Fed. Sts.Middle East & North AfricaMiddle East & North Africa (excluding high income)Middle East & North Africa (IDA & IBRD countries)Middle incomeMoldovaMonacoMongoliaMontenegroMoroccoMozambiqueMyanmarNamibiaNepalNetherlandsNew CaledoniaNew ZealandNicaraguaNigerNigeriaNorth AmericaNorwayOECD membersOmanOther small statesPacific island small statesPakistanPalauPanamaPapua New GuineaParaguayPeruPhilippinesPolandPortugalPost-demographic dividendPre-demographic dividendPuerto RicoQatarRomaniaRussian FederationRwandaSamoaSan MarinoSao Tome and PrincipeSaudi ArabiaSenegalSerbiaSeychellesSierra LeoneSingaporeSlovak RepublicSloveniaSmall statesSolomon IslandsSomaliaSouth AfricaSouth AsiaSouth Asia (IDA & IBRD)South SudanSpainSri LankaSt. Kitts and NevisSt. LuciaSt. Vincent and the GrenadinesSub-Saharan Africa Sub-Saharan Africa (excluding high income)Sub-Saharan Africa (IDA & IBRD countries)SudanSurinameSwazilandSwedenSwitzerlandSyrian Arab RepublicTajikistanTanzaniaThailandTimor-LesteTogoTongaTrinidad and TobagoTunisiaTurkeyTurkmenistanTuvaluUgandaUkraineUnited Arab EmiratesUnited KingdomUnited StatesUpper middle incomeUruguayUzbekistanVanuatuVenezuela, RBVietnamVirgin Islands (U.S.)West Bank and GazaWorldYemen, Rep.ZambiaZimbabwe Timeline:
This timeline shows a graph from 1971 to 2016 of IDA only. No data until 1970. Number of actual observations by date: 46.
Source name:
World Development Indicators
Source organization:
Estimates based on sources and methods described in "The Changing Wealth of Nations: Measuring Sustainable Development in the New Millennium" (World Bank, 2011).
Categories, topics:
Energy & Mining, Environment
Last updated:
apr 23, 2017
Indicators value changes by year
At the date of observation
Value
Absolute change
Change from previous value
jan 1, 1971
2.464
+2.464
0.0%
jan 1, 1972
1.578
-0.887
-35.98%
jan 1, 1973
1.65
+0.072
4.58%
jan 1, 1974
2.515
+0.865
52.44%
jan 1, 1975
2.647
+0.132
5.25%
jan 1, 1976
1.052
-1.595
-60.24%
jan 1, 1977
1.322
+0.27
25.62%
jan 1, 1978
0.934
-0.388
-29.35%
jan 1, 1979
0.614
-0.32
-34.23%
jan 1, 1980
0.943
+0.329
53.53%
jan 1, 1981
1.088
+0.145
15.34%
jan 1, 1982
0.66
-0.428
-39.36%
jan 1, 1983
0.557
-0.102
-15.52%
jan 1, 1984
0.579
+0.022
3.86%
jan 1, 1985
0.494
-0.085
-14.6%
jan 1, 1986
0.438
-0.056
-11.31%
jan 1, 1987
0.52
+0.082
18.63%
jan 1, 1988
0.507
-0.013
-2.45%
jan 1, 1989
0.847
+0.34
66.94%
jan 1, 1990
1.046
+0.198
23.43%
jan 1, 1991
0.759
-0.286
-27.39%
jan 1, 1992
0.587
-0.173
-22.75%
jan 1, 1993
0.524
-0.063
-10.69%
jan 1, 1994
0.353
-0.171
-32.59%
jan 1, 1995
0.494
+0.141
39.94%
jan 1, 1996
0.407
-0.087
-17.58%
jan 1, 1997
0.329
-0.079
-19.3%
jan 1, 1998
0.295
-0.033
-10.13%
jan 1, 1999
0.191
-0.105
-35.39%
jan 1, 2000
0.149
-0.042
-22.08%
jan 1, 2001
0.168
+0.02
13.3%
jan 1, 2002
0.155
-0.013
-7.96%
jan 1, 2003
0.202
+0.047
30.34%
jan 1, 2004
0.296
+0.094
46.46%
jan 1, 2005
0.494
+0.198
66.95%
jan 1, 2006
0.755
+0.261
52.79%
jan 1, 2007
1.481
+0.726
96.17%
jan 1, 2008
1.598
+0.117
7.87%
jan 1, 2009
1.769
+0.171
10.69%
jan 1, 2010
1.68
-0.088
-5.0%
jan 1, 2011
2.542
+0.862
51.29%
jan 1, 2012
3.232
+0.69
27.16%
jan 1, 2013
3.345
+0.113
3.49%
jan 1, 2014
3.22
-0.125
-3.74%
jan 1, 2015
2.692
-0.528
-16.41%
jan 1, 2016
2.027
-0.664
-24.68%
Ranking of countries by current statistics by years


Comments: