29
/
en
AIzaSyAYiBZKx7MnpbEhh9jyipgxe19OcubqV5w
April 1, 2024
40119
IDA total
IDA
false
2
1
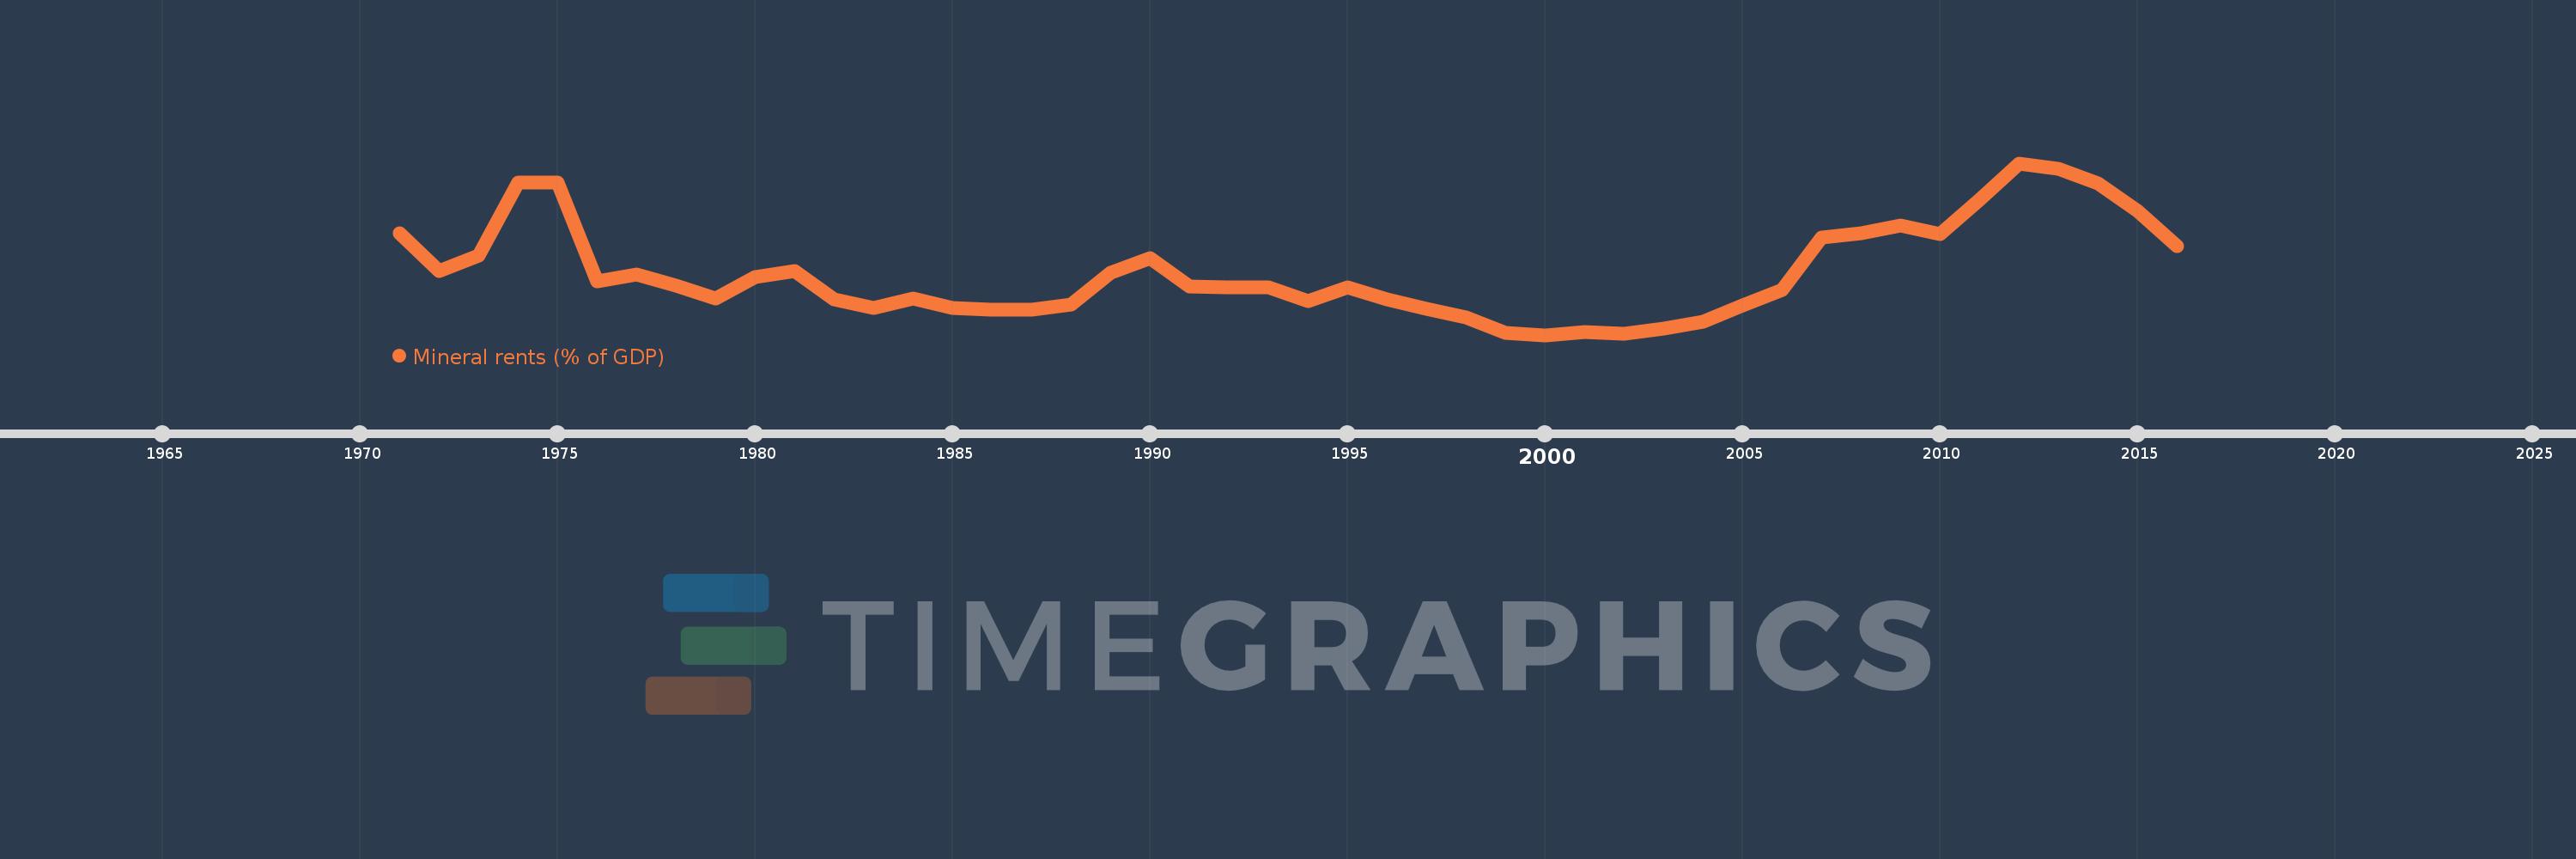
Mineral rents (% of GDP)
2016,2015,2014,2013,2012,2011,2010,2009,2008,2007,2006,2005,2004,2003,2002,2001,2000,1999,1998,1997,1996,1995,1994,1993,1992,1991,1990,1989,1988,1987,1986,1985,1984,1983,1982,1981,1980,1979,1978,1977,1976,1975,1974,1973,1972,1971
This statistics in other country:
AfghanistanAlbaniaAlgeriaAndorraAngolaAntigua and BarbudaArab WorldArgentinaArmeniaArubaAustraliaAustriaAzerbaijanBahamas, TheBahrainBangladeshBarbadosBelarusBelgiumBelizeBeninBermudaBhutanBoliviaBosnia and HerzegovinaBotswanaBrazilBrunei DarussalamBulgariaBurkina FasoBurundiCabo VerdeCambodiaCameroonCanadaCaribbean small statesCayman IslandsCentral African RepublicCentral Europe and the BalticsChadChannel IslandsChileChinaColombiaComorosCongo, Dem. Rep.Congo, Rep.Costa RicaCote d'IvoireCroatiaCubaCyprusCzech RepublicDenmarkDjiboutiDominicaDominican RepublicEarly-demographic dividendEast Asia & PacificEast Asia & Pacific (excluding high income)East Asia & Pacific (IDA & IBRD countries)EcuadorEgypt, Arab Rep.El SalvadorEquatorial GuineaEritreaEstoniaEthiopiaEuro areaEurope & Central AsiaEurope & Central Asia (excluding high income)Europe & Central Asia (IDA & IBRD countries)European UnionFaroe IslandsFijiFinlandFragile and conflict affected situationsFranceFrench PolynesiaGabonGambia, TheGeorgiaGermanyGhanaGreeceGreenlandGrenadaGuatemalaGuineaGuinea-BissauGuyanaHaitiHeavily indebted poor countries (HIPC)High incomeHondurasHong Kong SAR, ChinaHungaryIBRD onlyIcelandIDA & IBRD totalIDA blendIDA onlyIDA totalIndiaIndonesiaIran, Islamic Rep.IraqIrelandIsle of ManIsraelItalyJamaicaJapanJordanKazakhstanKenyaKiribatiKorea, Rep.KosovoKuwaitKyrgyz RepublicLao PDRLate-demographic dividendLatin America & Caribbean Latin America & Caribbean (excluding high income)Latin America & the Caribbean (IDA & IBRD countries)LatviaLeast developed countries: UN classificationLebanonLesothoLiberiaLibyaLiechtensteinLithuaniaLow & middle incomeLow incomeLower middle incomeLuxembourgMacao SAR, ChinaMacedonia, FYRMadagascarMalawiMalaysiaMaldivesMaliMaltaMarshall IslandsMauritaniaMauritiusMexicoMicronesia, Fed. Sts.Middle East & North AfricaMiddle East & North Africa (excluding high income)Middle East & North Africa (IDA & IBRD countries)Middle incomeMoldovaMonacoMongoliaMontenegroMoroccoMozambiqueMyanmarNamibiaNepalNetherlandsNew CaledoniaNew ZealandNicaraguaNigerNigeriaNorth AmericaNorwayOECD membersOmanOther small statesPacific island small statesPakistanPalauPanamaPapua New GuineaParaguayPeruPhilippinesPolandPortugalPost-demographic dividendPre-demographic dividendPuerto RicoQatarRomaniaRussian FederationRwandaSamoaSan MarinoSao Tome and PrincipeSaudi ArabiaSenegalSerbiaSeychellesSierra LeoneSingaporeSlovak RepublicSloveniaSmall statesSolomon IslandsSomaliaSouth AfricaSouth AsiaSouth Asia (IDA & IBRD)South SudanSpainSri LankaSt. Kitts and NevisSt. LuciaSt. Vincent and the GrenadinesSub-Saharan Africa Sub-Saharan Africa (excluding high income)Sub-Saharan Africa (IDA & IBRD countries)SudanSurinameSwazilandSwedenSwitzerlandSyrian Arab RepublicTajikistanTanzaniaThailandTimor-LesteTogoTongaTrinidad and TobagoTunisiaTurkeyTurkmenistanTuvaluUgandaUkraineUnited Arab EmiratesUnited KingdomUnited StatesUpper middle incomeUruguayUzbekistanVanuatuVenezuela, RBVietnamVirgin Islands (U.S.)West Bank and GazaWorldYemen, Rep.ZambiaZimbabwe Timeline:
This timeline shows a graph from 1971 to 2016 of IDA total. No data until 1970. Number of actual observations by date: 46.
Source name:
World Development Indicators
Source organization:
Estimates based on sources and methods described in "The Changing Wealth of Nations: Measuring Sustainable Development in the New Millennium" (World Bank, 2011).
Categories, topics:
Energy & Mining, Environment
Last updated:
apr 23, 2017
Indicators value changes by year
At the date of observation
Value
Absolute change
Change from previous value
jan 1, 1971
1.388
+1.388
0.0%
jan 1, 1972
0.942
-0.445
-32.1%
jan 1, 1973
1.126
+0.184
19.51%
jan 1, 1974
1.978
+0.852
75.62%
jan 1, 1975
1.984
+0.007
0.34%
jan 1, 1976
0.825
-1.16
-58.43%
jan 1, 1977
0.904
+0.079
9.61%
jan 1, 1978
0.775
-0.129
-14.32%
jan 1, 1979
0.626
-0.148
-19.16%
jan 1, 1980
0.873
+0.247
39.38%
jan 1, 1981
0.949
+0.076
8.7%
jan 1, 1982
0.61
-0.339
-35.72%
jan 1, 1983
0.51
-0.1
-16.42%
jan 1, 1984
0.623
+0.113
22.15%
jan 1, 1985
0.514
-0.109
-17.45%
jan 1, 1986
0.493
-0.021
-4.14%
jan 1, 1987
0.491
-0.002
-0.31%
jan 1, 1988
0.551
+0.06
12.16%
jan 1, 1989
0.926
+0.375
68.04%
jan 1, 1990
1.092
+0.166
17.94%
jan 1, 1991
0.769
-0.323
-29.55%
jan 1, 1992
0.759
-0.01
-1.28%
jan 1, 1993
0.753
-0.006
-0.81%
jan 1, 1994
0.59
-0.163
-21.68%
jan 1, 1995
0.754
+0.164
27.77%
jan 1, 1996
0.618
-0.136
-17.99%
jan 1, 1997
0.499
-0.119
-19.28%
jan 1, 1998
0.399
-0.1
-20.07%
jan 1, 1999
0.222
-0.176
-44.23%
jan 1, 2000
0.196
-0.027
-12.08%
jan 1, 2001
0.233
+0.037
18.94%
jan 1, 2002
0.207
-0.026
-11.14%
jan 1, 2003
0.268
+0.061
29.55%
jan 1, 2004
0.354
+0.087
32.35%
jan 1, 2005
0.547
+0.193
54.37%
jan 1, 2006
0.724
+0.177
32.31%
jan 1, 2007
1.335
+0.611
84.4%
jan 1, 2008
1.393
+0.058
4.34%
jan 1, 2009
1.476
+0.084
6.0%
jan 1, 2010
1.383
-0.094
-6.33%
jan 1, 2011
1.785
+0.403
29.11%
jan 1, 2012
2.209
+0.423
23.71%
jan 1, 2013
2.145
-0.064
-2.89%
jan 1, 2014
1.975
-0.17
-7.92%
jan 1, 2015
1.655
-0.32
-16.19%
jan 1, 2016
1.24
-0.416
-25.1%
Ranking of countries by current statistics by years


Comments: