29
/
en
AIzaSyAYiBZKx7MnpbEhh9jyipgxe19OcubqV5w
April 1, 2024
132275
Fiji
FJI
true
2
1
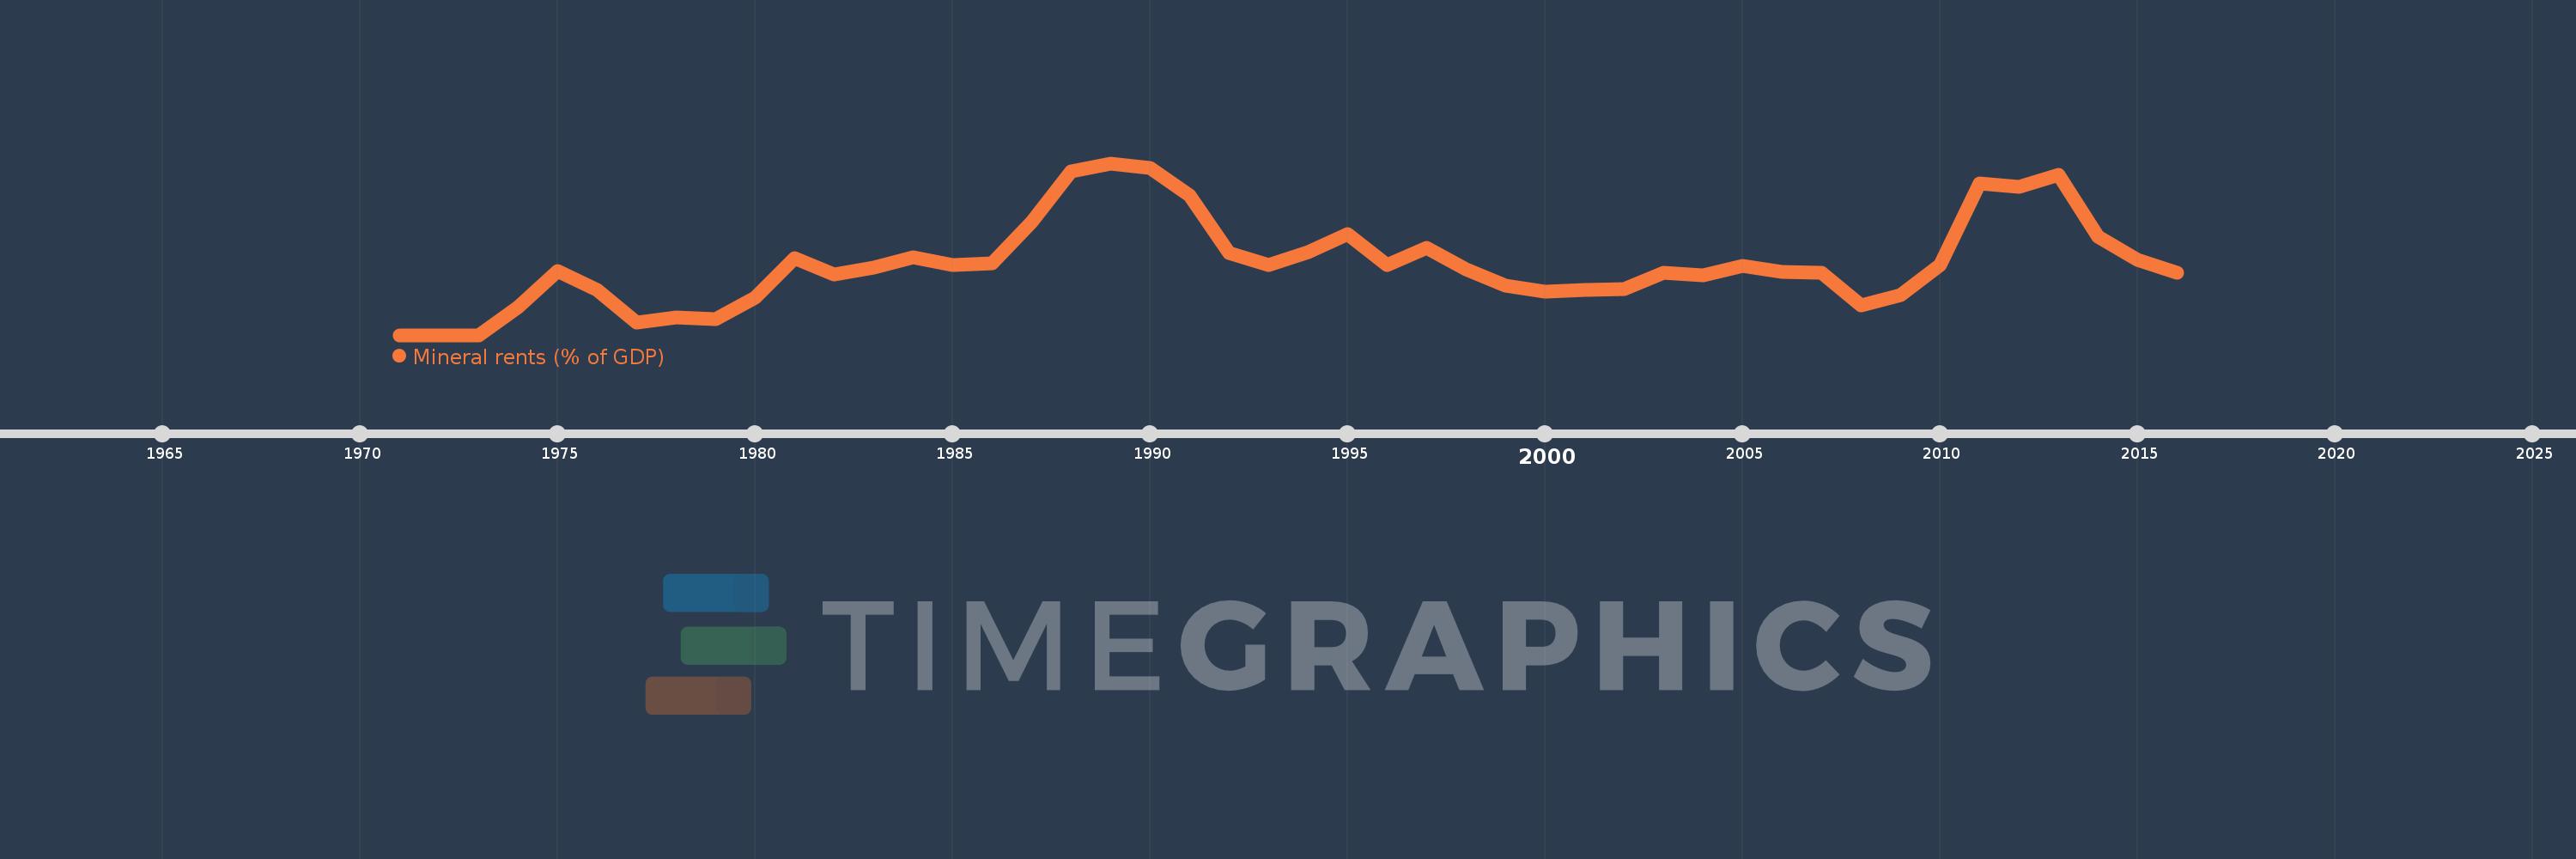
Mineral rents (% of GDP)
2016,2015,2014,2013,2012,2011,2010,2009,2008,2007,2006,2005,2004,2003,2002,2001,2000,1999,1998,1997,1996,1995,1994,1993,1992,1991,1990,1989,1988,1987,1986,1985,1984,1983,1982,1981,1980,1979,1978,1977,1976,1975,1974,1973,1972,1971
This statistics in other country:
AfghanistanAlbaniaAlgeriaAndorraAngolaAntigua and BarbudaArab WorldArgentinaArmeniaArubaAustraliaAustriaAzerbaijanBahamas, TheBahrainBangladeshBarbadosBelarusBelgiumBelizeBeninBermudaBhutanBoliviaBosnia and HerzegovinaBotswanaBrazilBrunei DarussalamBulgariaBurkina FasoBurundiCabo VerdeCambodiaCameroonCanadaCaribbean small statesCayman IslandsCentral African RepublicCentral Europe and the BalticsChadChannel IslandsChileChinaColombiaComorosCongo, Dem. Rep.Congo, Rep.Costa RicaCote d'IvoireCroatiaCubaCyprusCzech RepublicDenmarkDjiboutiDominicaDominican RepublicEarly-demographic dividendEast Asia & PacificEast Asia & Pacific (excluding high income)East Asia & Pacific (IDA & IBRD countries)EcuadorEgypt, Arab Rep.El SalvadorEquatorial GuineaEritreaEstoniaEthiopiaEuro areaEurope & Central AsiaEurope & Central Asia (excluding high income)Europe & Central Asia (IDA & IBRD countries)European UnionFaroe IslandsFijiFinlandFragile and conflict affected situationsFranceFrench PolynesiaGabonGambia, TheGeorgiaGermanyGhanaGreeceGreenlandGrenadaGuatemalaGuineaGuinea-BissauGuyanaHaitiHeavily indebted poor countries (HIPC)High incomeHondurasHong Kong SAR, ChinaHungaryIBRD onlyIcelandIDA & IBRD totalIDA blendIDA onlyIDA totalIndiaIndonesiaIran, Islamic Rep.IraqIrelandIsle of ManIsraelItalyJamaicaJapanJordanKazakhstanKenyaKiribatiKorea, Rep.KosovoKuwaitKyrgyz RepublicLao PDRLate-demographic dividendLatin America & Caribbean Latin America & Caribbean (excluding high income)Latin America & the Caribbean (IDA & IBRD countries)LatviaLeast developed countries: UN classificationLebanonLesothoLiberiaLibyaLiechtensteinLithuaniaLow & middle incomeLow incomeLower middle incomeLuxembourgMacao SAR, ChinaMacedonia, FYRMadagascarMalawiMalaysiaMaldivesMaliMaltaMarshall IslandsMauritaniaMauritiusMexicoMicronesia, Fed. Sts.Middle East & North AfricaMiddle East & North Africa (excluding high income)Middle East & North Africa (IDA & IBRD countries)Middle incomeMoldovaMonacoMongoliaMontenegroMoroccoMozambiqueMyanmarNamibiaNepalNetherlandsNew CaledoniaNew ZealandNicaraguaNigerNigeriaNorth AmericaNorwayOECD membersOmanOther small statesPacific island small statesPakistanPalauPanamaPapua New GuineaParaguayPeruPhilippinesPolandPortugalPost-demographic dividendPre-demographic dividendPuerto RicoQatarRomaniaRussian FederationRwandaSamoaSan MarinoSao Tome and PrincipeSaudi ArabiaSenegalSerbiaSeychellesSierra LeoneSingaporeSlovak RepublicSloveniaSmall statesSolomon IslandsSomaliaSouth AfricaSouth AsiaSouth Asia (IDA & IBRD)South SudanSpainSri LankaSt. Kitts and NevisSt. LuciaSt. Vincent and the GrenadinesSub-Saharan Africa Sub-Saharan Africa (excluding high income)Sub-Saharan Africa (IDA & IBRD countries)SudanSurinameSwazilandSwedenSwitzerlandSyrian Arab RepublicTajikistanTanzaniaThailandTimor-LesteTogoTongaTrinidad and TobagoTunisiaTurkeyTurkmenistanTuvaluUgandaUkraineUnited Arab EmiratesUnited KingdomUnited StatesUpper middle incomeUruguayUzbekistanVanuatuVenezuela, RBVietnamVirgin Islands (U.S.)West Bank and GazaWorldYemen, Rep.ZambiaZimbabwe Timeline:
This timeline shows a graph from 1971 to 2016 of Fiji. No data until 1970. Number of actual observations by date: 46.
Source name:
World Development Indicators
Source organization:
Estimates based on sources and methods described in "The Changing Wealth of Nations: Measuring Sustainable Development in the New Millennium" (World Bank, 2011).
Categories, topics:
Energy & Mining, Environment
Last updated:
apr 23, 2017
Indicators value changes by year
At the date of observation
Value
Absolute change
Change from previous value
jan 1, 1975
0.775
+0.435
127.83%
jan 1, 1976
0.541
-0.234
-30.2%
jan 1, 1977
0.154
-0.387
-71.48%
jan 1, 1978
0.209
+0.054
35.27%
jan 1, 1979
0.193
-0.016
-7.66%
jan 1, 1980
0.45
+0.257
133.58%
jan 1, 1981
0.928
+0.478
106.2%
jan 1, 1982
0.73
-0.198
-21.31%
jan 1, 1983
0.817
+0.087
11.98%
jan 1, 1984
0.944
+0.127
15.55%
jan 1, 1985
0.847
-0.097
-10.27%
jan 1, 1986
0.866
+0.019
2.19%
jan 1, 1987
1.364
+0.498
57.47%
jan 1, 1988
1.982
+0.618
45.33%
jan 1, 1989
2.08
+0.098
4.93%
jan 1, 1990
2.023
-0.056
-2.71%
jan 1, 1991
1.69
-0.333
-16.45%
jan 1, 1992
0.989
-0.701
-41.46%
jan 1, 1993
0.844
-0.145
-14.69%
jan 1, 1994
1.007
+0.162
19.25%
jan 1, 1995
1.222
+0.216
21.44%
jan 1, 1996
0.847
-0.376
-30.74%
jan 1, 1997
1.052
+0.205
24.22%
jan 1, 1998
0.794
-0.257
-24.48%
jan 1, 1999
0.597
-0.197
-24.79%
jan 1, 2000
0.528
-0.069
-11.55%
jan 1, 2001
0.55
+0.022
4.09%
jan 1, 2002
0.557
+0.007
1.33%
jan 1, 2003
0.754
+0.197
35.36%
jan 1, 2004
0.719
-0.036
-4.71%
jan 1, 2005
0.841
+0.122
16.95%
jan 1, 2006
0.761
-0.08
-9.47%
jan 1, 2007
0.759
-0.002
-0.21%
jan 1, 2008
0.357
-0.402
-52.96%
jan 1, 2009
0.483
+0.126
35.29%
jan 1, 2010
0.845
+0.362
74.89%
jan 1, 2011
1.84
+0.994
117.67%
jan 1, 2012
1.797
-0.042
-2.29%
jan 1, 2013
1.939
+0.142
7.89%
jan 1, 2014
1.195
-0.744
-38.36%
jan 1, 2015
0.915
-0.28
-23.46%
jan 1, 2016
0.749
-0.166
-18.18%
Ranking of countries by current statistics by years


Comments: