29
/
en
AIzaSyAYiBZKx7MnpbEhh9jyipgxe19OcubqV5w
April 1, 2024
58327
South Asia (IDA & IBRD)
TSA
false
2
1
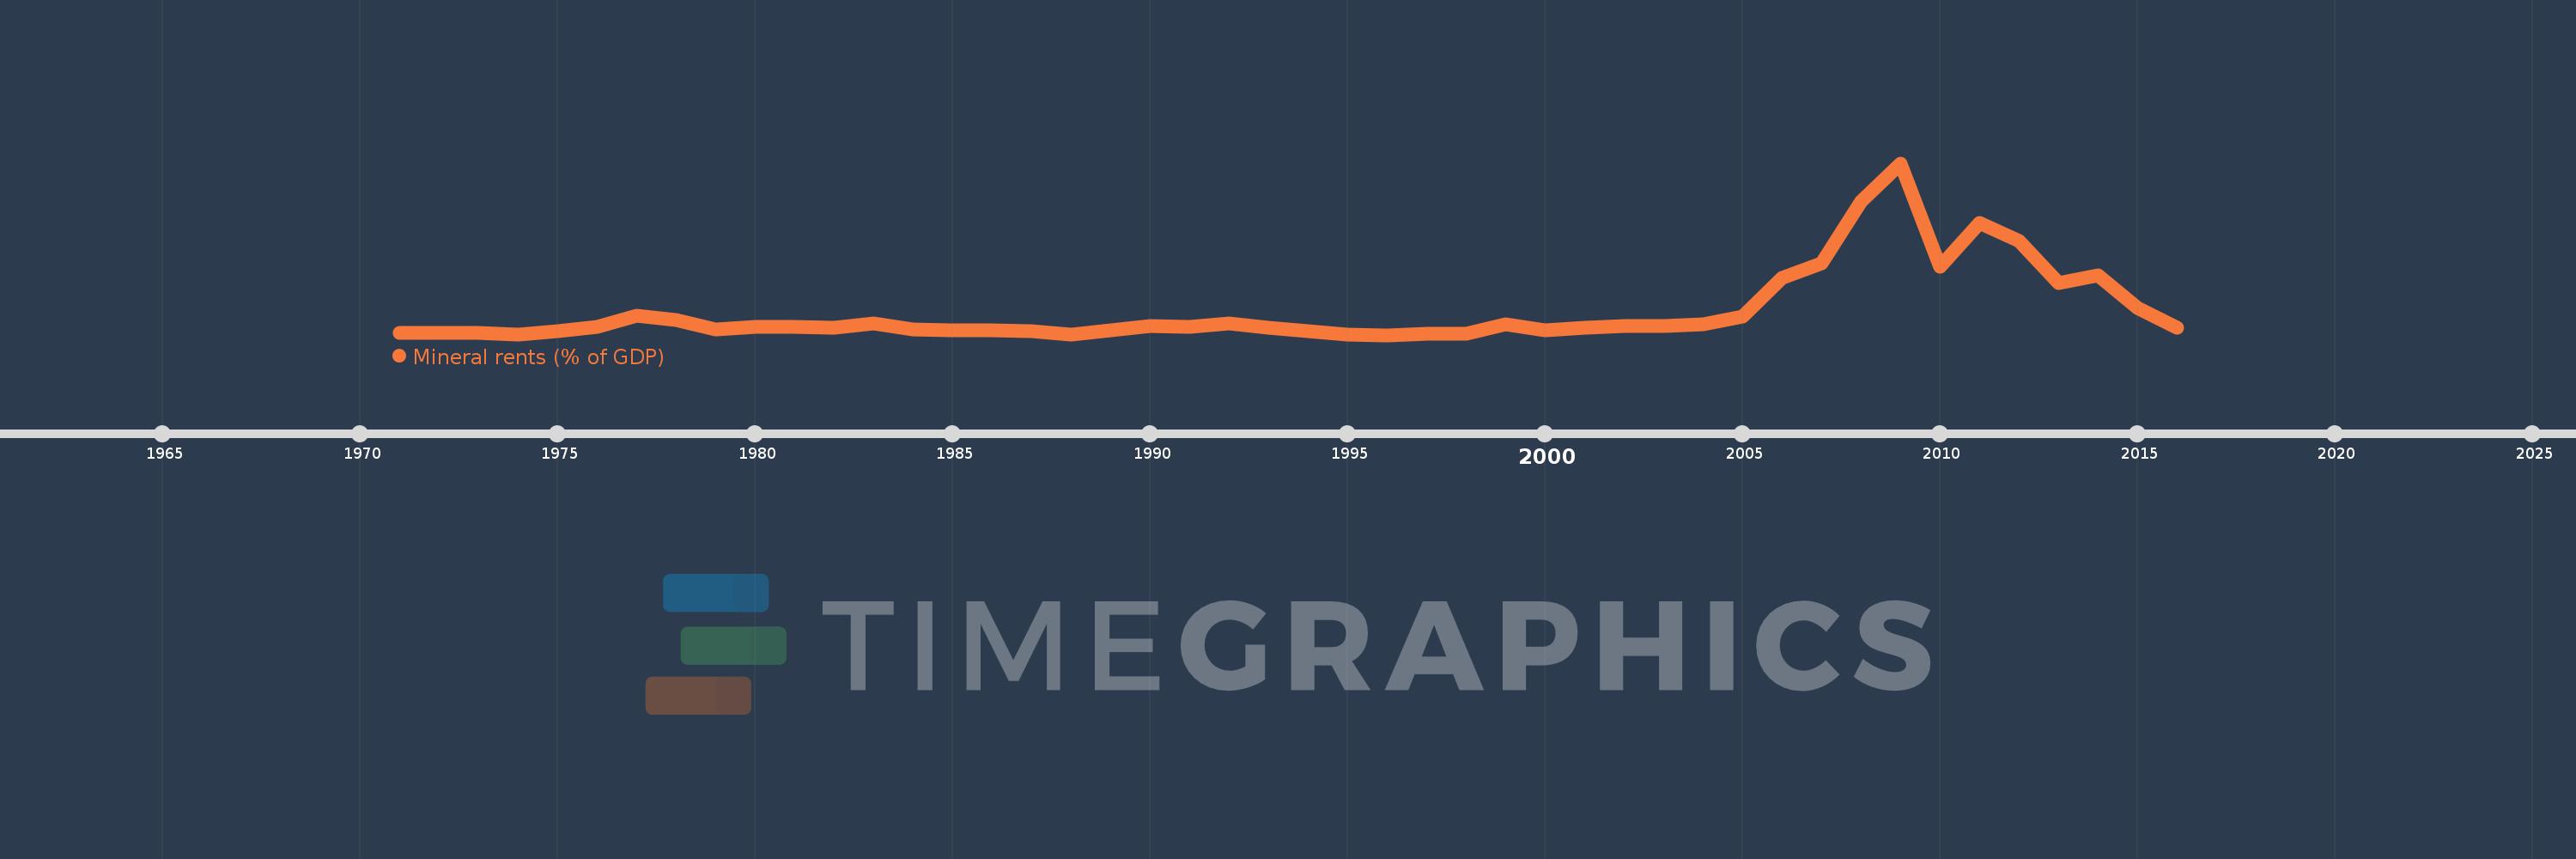
Mineral rents (% of GDP)
2016,2015,2014,2013,2012,2011,2010,2009,2008,2007,2006,2005,2004,2003,2002,2001,2000,1999,1998,1997,1996,1995,1994,1993,1992,1991,1990,1989,1988,1987,1986,1985,1984,1983,1982,1981,1980,1979,1978,1977,1976,1975,1974,1973,1972,1971
This statistics in other country:
AfghanistanAlbaniaAlgeriaAndorraAngolaAntigua and BarbudaArab WorldArgentinaArmeniaArubaAustraliaAustriaAzerbaijanBahamas, TheBahrainBangladeshBarbadosBelarusBelgiumBelizeBeninBermudaBhutanBoliviaBosnia and HerzegovinaBotswanaBrazilBrunei DarussalamBulgariaBurkina FasoBurundiCabo VerdeCambodiaCameroonCanadaCaribbean small statesCayman IslandsCentral African RepublicCentral Europe and the BalticsChadChannel IslandsChileChinaColombiaComorosCongo, Dem. Rep.Congo, Rep.Costa RicaCote d'IvoireCroatiaCubaCyprusCzech RepublicDenmarkDjiboutiDominicaDominican RepublicEarly-demographic dividendEast Asia & PacificEast Asia & Pacific (excluding high income)East Asia & Pacific (IDA & IBRD countries)EcuadorEgypt, Arab Rep.El SalvadorEquatorial GuineaEritreaEstoniaEthiopiaEuro areaEurope & Central AsiaEurope & Central Asia (excluding high income)Europe & Central Asia (IDA & IBRD countries)European UnionFaroe IslandsFijiFinlandFragile and conflict affected situationsFranceFrench PolynesiaGabonGambia, TheGeorgiaGermanyGhanaGreeceGreenlandGrenadaGuatemalaGuineaGuinea-BissauGuyanaHaitiHeavily indebted poor countries (HIPC)High incomeHondurasHong Kong SAR, ChinaHungaryIBRD onlyIcelandIDA & IBRD totalIDA blendIDA onlyIDA totalIndiaIndonesiaIran, Islamic Rep.IraqIrelandIsle of ManIsraelItalyJamaicaJapanJordanKazakhstanKenyaKiribatiKorea, Rep.KosovoKuwaitKyrgyz RepublicLao PDRLate-demographic dividendLatin America & Caribbean Latin America & Caribbean (excluding high income)Latin America & the Caribbean (IDA & IBRD countries)LatviaLeast developed countries: UN classificationLebanonLesothoLiberiaLibyaLiechtensteinLithuaniaLow & middle incomeLow incomeLower middle incomeLuxembourgMacao SAR, ChinaMacedonia, FYRMadagascarMalawiMalaysiaMaldivesMaliMaltaMarshall IslandsMauritaniaMauritiusMexicoMicronesia, Fed. Sts.Middle East & North AfricaMiddle East & North Africa (excluding high income)Middle East & North Africa (IDA & IBRD countries)Middle incomeMoldovaMonacoMongoliaMontenegroMoroccoMozambiqueMyanmarNamibiaNepalNetherlandsNew CaledoniaNew ZealandNicaraguaNigerNigeriaNorth AmericaNorwayOECD membersOmanOther small statesPacific island small statesPakistanPalauPanamaPapua New GuineaParaguayPeruPhilippinesPolandPortugalPost-demographic dividendPre-demographic dividendPuerto RicoQatarRomaniaRussian FederationRwandaSamoaSan MarinoSao Tome and PrincipeSaudi ArabiaSenegalSerbiaSeychellesSierra LeoneSingaporeSlovak RepublicSloveniaSmall statesSolomon IslandsSomaliaSouth AfricaSouth AsiaSouth Asia (IDA & IBRD)South SudanSpainSri LankaSt. Kitts and NevisSt. LuciaSt. Vincent and the GrenadinesSub-Saharan Africa Sub-Saharan Africa (excluding high income)Sub-Saharan Africa (IDA & IBRD countries)SudanSurinameSwazilandSwedenSwitzerlandSyrian Arab RepublicTajikistanTanzaniaThailandTimor-LesteTogoTongaTrinidad and TobagoTunisiaTurkeyTurkmenistanTuvaluUgandaUkraineUnited Arab EmiratesUnited KingdomUnited StatesUpper middle incomeUruguayUzbekistanVanuatuVenezuela, RBVietnamVirgin Islands (U.S.)West Bank and GazaWorldYemen, Rep.ZambiaZimbabwe Timeline:
This timeline shows a graph from 1971 to 2016 of South Asia (IDA & IBRD). No data until 1970. Number of actual observations by date: 46.
Source name:
World Development Indicators
Source organization:
Estimates based on sources and methods described in "The Changing Wealth of Nations: Measuring Sustainable Development in the New Millennium" (World Bank, 2011).
Categories, topics:
Energy & Mining, Environment
Last updated:
apr 23, 2017
Indicators value changes by year
At the date of observation
Value
Absolute change
Change from previous value
jan 1, 1971
0.165
+0.165
0.0%
jan 1, 1972
0.172
+0.007
4.53%
jan 1, 1973
0.169
-0.003
-1.84%
jan 1, 1974
0.151
-0.018
-10.58%
jan 1, 1975
0.184
+0.033
21.5%
jan 1, 1976
0.235
+0.051
27.93%
jan 1, 1977
0.36
+0.125
53.16%
jan 1, 1978
0.311
-0.049
-13.56%
jan 1, 1979
0.21
-0.101
-32.36%
jan 1, 1980
0.237
+0.027
12.72%
jan 1, 1981
0.24
+0.003
1.35%
jan 1, 1982
0.223
-0.018
-7.3%
jan 1, 1983
0.271
+0.048
21.52%
jan 1, 1984
0.205
-0.066
-24.22%
jan 1, 1985
0.199
-0.006
-2.85%
jan 1, 1986
0.195
-0.004
-2.05%
jan 1, 1987
0.189
-0.006
-3.12%
jan 1, 1988
0.152
-0.037
-19.61%
jan 1, 1989
0.2
+0.048
31.54%
jan 1, 1990
0.25
+0.05
24.87%
jan 1, 1991
0.238
-0.012
-4.61%
jan 1, 1992
0.271
+0.033
13.86%
jan 1, 1993
0.228
-0.043
-16.0%
jan 1, 1994
0.19
-0.038
-16.64%
jan 1, 1995
0.146
-0.044
-23.31%
jan 1, 1996
0.145
-0.001
-0.72%
jan 1, 1997
0.155
+0.011
7.38%
jan 1, 1998
0.157
+0.002
0.97%
jan 1, 1999
0.26
+0.103
65.58%
jan 1, 2000
0.198
-0.062
-23.95%
jan 1, 2001
0.224
+0.026
13.29%
jan 1, 2002
0.247
+0.024
10.57%
jan 1, 2003
0.248
+0.0
0.1%
jan 1, 2004
0.266
+0.019
7.54%
jan 1, 2005
0.354
+0.088
33.07%
jan 1, 2006
0.778
+0.424
119.48%
jan 1, 2007
0.945
+0.167
21.44%
jan 1, 2008
1.636
+0.691
73.18%
jan 1, 2009
2.061
+0.425
25.94%
jan 1, 2010
0.902
-1.159
-56.23%
jan 1, 2011
1.394
+0.492
54.58%
jan 1, 2012
1.194
-0.2
-14.36%
jan 1, 2013
0.72
-0.474
-39.7%
jan 1, 2014
0.814
+0.094
13.11%
jan 1, 2015
0.446
-0.368
-45.2%
jan 1, 2016
0.225
-0.221
-49.48%
Ranking of countries by current statistics by years


Comments: