29
/
en
AIzaSyAYiBZKx7MnpbEhh9jyipgxe19OcubqV5w
April 1, 2024
254375
Suriname
SUR
true
2
1
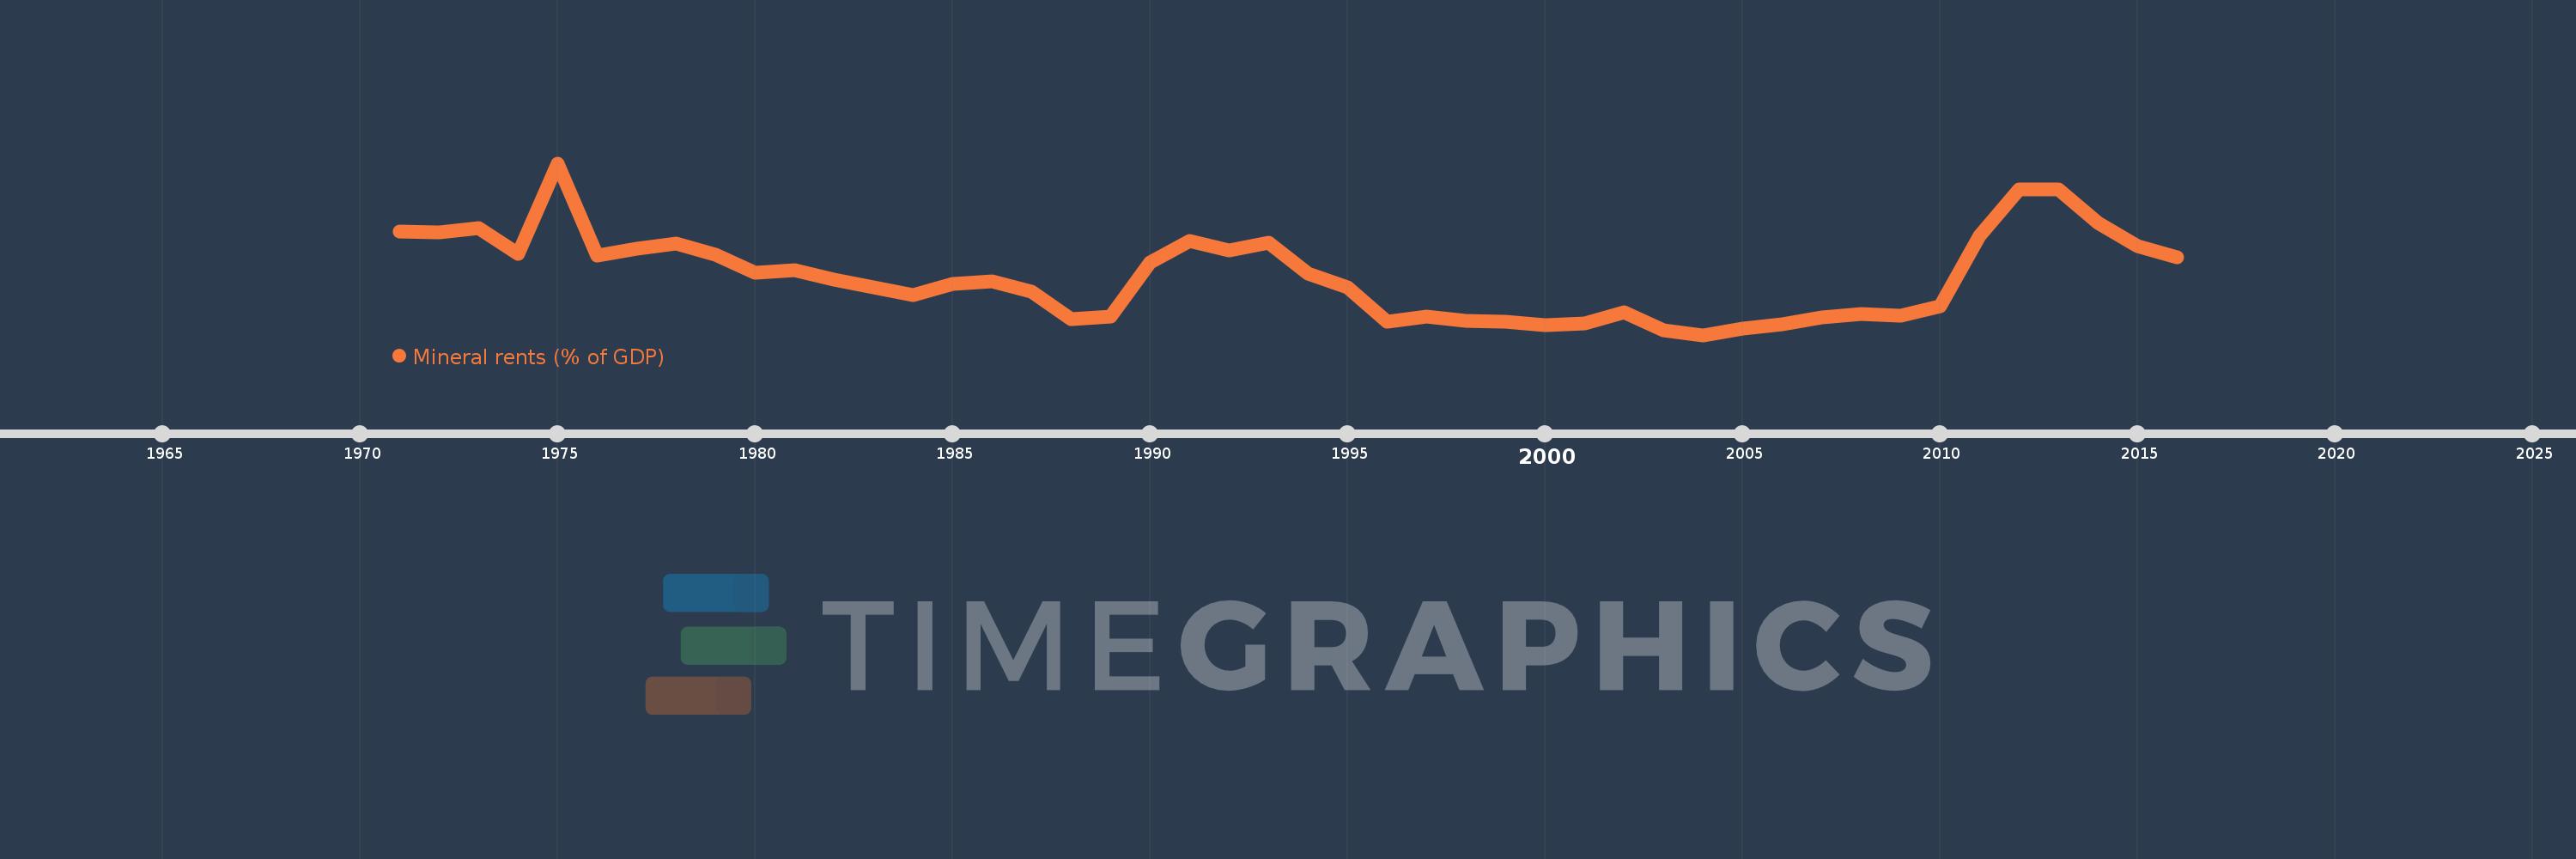
Mineral rents (% of GDP)
2016,2015,2014,2013,2012,2011,2010,2009,2008,2007,2006,2005,2004,2003,2002,2001,2000,1999,1998,1997,1996,1995,1994,1993,1992,1991,1990,1989,1988,1987,1986,1985,1984,1983,1982,1981,1980,1979,1978,1977,1976,1975,1974,1973,1972,1971
This statistics in other country:
AfghanistanAlbaniaAlgeriaAndorraAngolaAntigua and BarbudaArab WorldArgentinaArmeniaArubaAustraliaAustriaAzerbaijanBahamas, TheBahrainBangladeshBarbadosBelarusBelgiumBelizeBeninBermudaBhutanBoliviaBosnia and HerzegovinaBotswanaBrazilBrunei DarussalamBulgariaBurkina FasoBurundiCabo VerdeCambodiaCameroonCanadaCaribbean small statesCayman IslandsCentral African RepublicCentral Europe and the BalticsChadChannel IslandsChileChinaColombiaComorosCongo, Dem. Rep.Congo, Rep.Costa RicaCote d'IvoireCroatiaCubaCyprusCzech RepublicDenmarkDjiboutiDominicaDominican RepublicEarly-demographic dividendEast Asia & PacificEast Asia & Pacific (excluding high income)East Asia & Pacific (IDA & IBRD countries)EcuadorEgypt, Arab Rep.El SalvadorEquatorial GuineaEritreaEstoniaEthiopiaEuro areaEurope & Central AsiaEurope & Central Asia (excluding high income)Europe & Central Asia (IDA & IBRD countries)European UnionFaroe IslandsFijiFinlandFragile and conflict affected situationsFranceFrench PolynesiaGabonGambia, TheGeorgiaGermanyGhanaGreeceGreenlandGrenadaGuatemalaGuineaGuinea-BissauGuyanaHaitiHeavily indebted poor countries (HIPC)High incomeHondurasHong Kong SAR, ChinaHungaryIBRD onlyIcelandIDA & IBRD totalIDA blendIDA onlyIDA totalIndiaIndonesiaIran, Islamic Rep.IraqIrelandIsle of ManIsraelItalyJamaicaJapanJordanKazakhstanKenyaKiribatiKorea, Rep.KosovoKuwaitKyrgyz RepublicLao PDRLate-demographic dividendLatin America & Caribbean Latin America & Caribbean (excluding high income)Latin America & the Caribbean (IDA & IBRD countries)LatviaLeast developed countries: UN classificationLebanonLesothoLiberiaLibyaLiechtensteinLithuaniaLow & middle incomeLow incomeLower middle incomeLuxembourgMacao SAR, ChinaMacedonia, FYRMadagascarMalawiMalaysiaMaldivesMaliMaltaMarshall IslandsMauritaniaMauritiusMexicoMicronesia, Fed. Sts.Middle East & North AfricaMiddle East & North Africa (excluding high income)Middle East & North Africa (IDA & IBRD countries)Middle incomeMoldovaMonacoMongoliaMontenegroMoroccoMozambiqueMyanmarNamibiaNepalNetherlandsNew CaledoniaNew ZealandNicaraguaNigerNigeriaNorth AmericaNorwayOECD membersOmanOther small statesPacific island small statesPakistanPalauPanamaPapua New GuineaParaguayPeruPhilippinesPolandPortugalPost-demographic dividendPre-demographic dividendPuerto RicoQatarRomaniaRussian FederationRwandaSamoaSan MarinoSao Tome and PrincipeSaudi ArabiaSenegalSerbiaSeychellesSierra LeoneSingaporeSlovak RepublicSloveniaSmall statesSolomon IslandsSomaliaSouth AfricaSouth AsiaSouth Asia (IDA & IBRD)South SudanSpainSri LankaSt. Kitts and NevisSt. LuciaSt. Vincent and the GrenadinesSub-Saharan Africa Sub-Saharan Africa (excluding high income)Sub-Saharan Africa (IDA & IBRD countries)SudanSurinameSwazilandSwedenSwitzerlandSyrian Arab RepublicTajikistanTanzaniaThailandTimor-LesteTogoTongaTrinidad and TobagoTunisiaTurkeyTurkmenistanTuvaluUgandaUkraineUnited Arab EmiratesUnited KingdomUnited StatesUpper middle incomeUruguayUzbekistanVanuatuVenezuela, RBVietnamVirgin Islands (U.S.)West Bank and GazaWorldYemen, Rep.ZambiaZimbabwe Timeline:
This timeline shows a graph from 1971 to 2016 of Suriname. No data until 1970. Number of actual observations by date: 46.
Source name:
World Development Indicators
Source organization:
Estimates based on sources and methods described in "The Changing Wealth of Nations: Measuring Sustainable Development in the New Millennium" (World Bank, 2011).
Categories, topics:
Energy & Mining, Environment
Last updated:
apr 23, 2017
Indicators value changes by year
Maximum:
30.681
jan 1, 1975
At the date of observation
Value
Absolute change
Change from previous value
jan 1, 1971
19.175
+19.175
0.0%
jan 1, 1972
19.004
-0.171
-0.89%
jan 1, 1973
19.635
+0.631
3.32%
jan 1, 1974
15.337
-4.298
-21.89%
jan 1, 1975
30.681
+15.344
100.05%
jan 1, 1976
15.082
-15.598
-50.84%
jan 1, 1977
16.208
+1.125
7.46%
jan 1, 1978
17.117
+0.909
5.61%
jan 1, 1979
15.183
-1.934
-11.3%
jan 1, 1980
12.2
-2.983
-19.65%
jan 1, 1981
12.595
+0.395
3.23%
jan 1, 1982
11.049
-1.546
-12.28%
jan 1, 1983
9.745
-1.304
-11.8%
jan 1, 1984
8.362
-1.383
-14.19%
jan 1, 1985
10.261
+1.899
22.71%
jan 1, 1986
10.736
+0.475
4.62%
jan 1, 1987
8.997
-1.739
-16.2%
jan 1, 1988
4.252
-4.745
-52.74%
jan 1, 1989
4.753
+0.5
11.77%
jan 1, 1990
13.883
+9.131
192.12%
jan 1, 1991
17.493
+3.61
26.0%
jan 1, 1992
15.898
-1.596
-9.12%
jan 1, 1993
17.242
+1.344
8.45%
jan 1, 1994
12.046
-5.195
-30.13%
jan 1, 1995
9.703
-2.344
-19.46%
jan 1, 1996
3.888
-5.815
-59.93%
jan 1, 1997
4.704
+0.816
20.98%
jan 1, 1998
4.05
-0.653
-13.89%
jan 1, 1999
3.901
-0.149
-3.68%
jan 1, 2000
3.214
-0.688
-17.62%
jan 1, 2001
3.578
+0.364
11.34%
jan 1, 2002
5.394
+1.816
50.77%
jan 1, 2003
2.424
-2.97
-55.06%
jan 1, 2004
1.608
-0.817
-33.68%
jan 1, 2005
2.685
+1.077
67.0%
jan 1, 2006
3.496
+0.811
30.2%
jan 1, 2007
4.568
+1.072
30.66%
jan 1, 2008
5.181
+0.613
13.41%
jan 1, 2009
4.836
-0.344
-6.65%
jan 1, 2010
6.427
+1.591
32.9%
jan 1, 2011
18.424
+11.996
186.64%
jan 1, 2012
26.196
+7.773
42.19%
jan 1, 2013
26.29
+0.094
0.36%
jan 1, 2014
20.629
-5.662
-21.54%
jan 1, 2015
16.66
-3.968
-19.24%
jan 1, 2016
14.823
-1.837
-11.03%
Ranking of countries by current statistics by years


Comments: