29
/
en
AIzaSyAYiBZKx7MnpbEhh9jyipgxe19OcubqV5w
April 1, 2024
111231
Congo, Rep.
COG
true
2
1
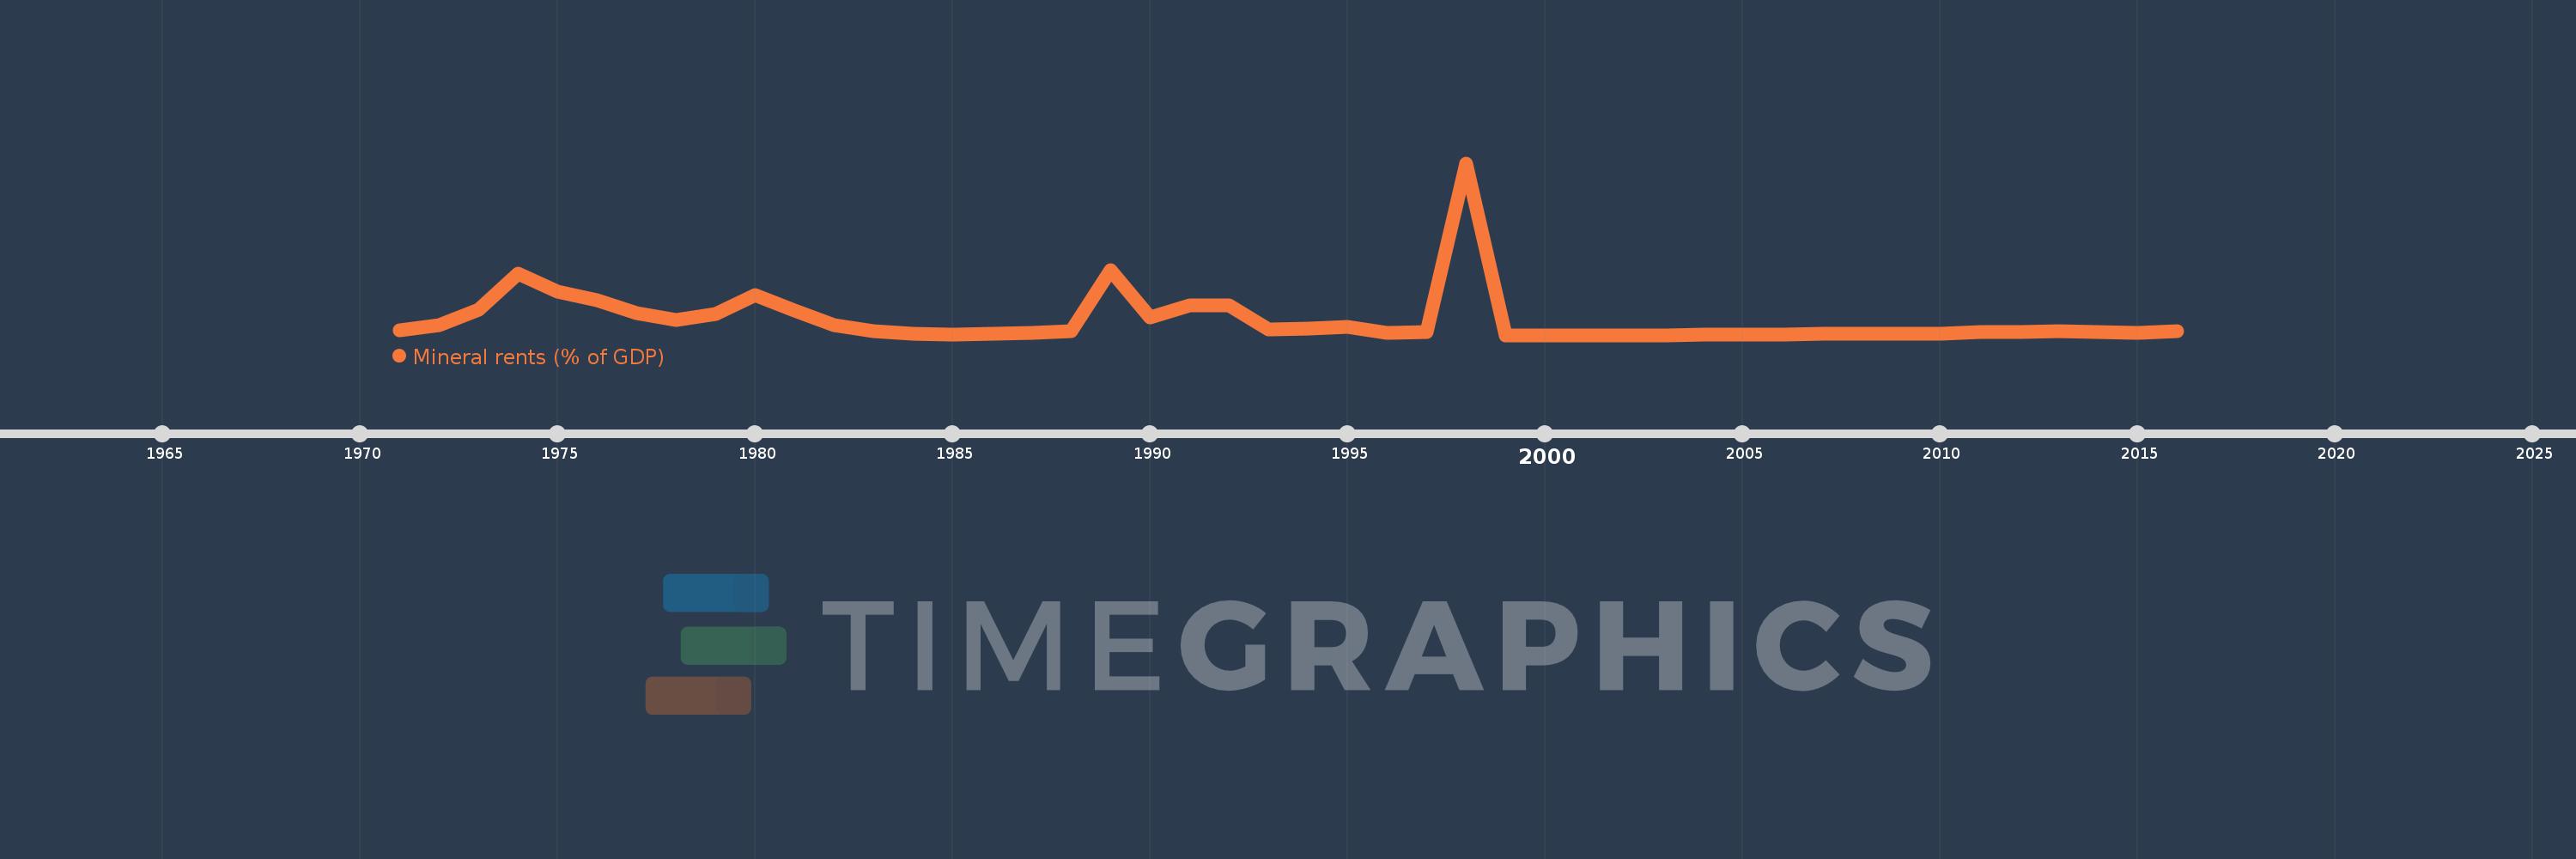
Mineral rents (% of GDP)
2016,2015,2014,2013,2012,2011,2010,2009,2008,2007,2006,2005,2004,2003,2002,2001,2000,1999,1998,1997,1996,1995,1994,1993,1992,1991,1990,1989,1988,1987,1986,1985,1984,1983,1982,1981,1980,1979,1978,1977,1976,1975,1974,1973,1972,1971
This statistics in other country:
AfghanistanAlbaniaAlgeriaAndorraAngolaAntigua and BarbudaArab WorldArgentinaArmeniaArubaAustraliaAustriaAzerbaijanBahamas, TheBahrainBangladeshBarbadosBelarusBelgiumBelizeBeninBermudaBhutanBoliviaBosnia and HerzegovinaBotswanaBrazilBrunei DarussalamBulgariaBurkina FasoBurundiCabo VerdeCambodiaCameroonCanadaCaribbean small statesCayman IslandsCentral African RepublicCentral Europe and the BalticsChadChannel IslandsChileChinaColombiaComorosCongo, Dem. Rep.Congo, Rep.Costa RicaCote d'IvoireCroatiaCubaCyprusCzech RepublicDenmarkDjiboutiDominicaDominican RepublicEarly-demographic dividendEast Asia & PacificEast Asia & Pacific (excluding high income)East Asia & Pacific (IDA & IBRD countries)EcuadorEgypt, Arab Rep.El SalvadorEquatorial GuineaEritreaEstoniaEthiopiaEuro areaEurope & Central AsiaEurope & Central Asia (excluding high income)Europe & Central Asia (IDA & IBRD countries)European UnionFaroe IslandsFijiFinlandFragile and conflict affected situationsFranceFrench PolynesiaGabonGambia, TheGeorgiaGermanyGhanaGreeceGreenlandGrenadaGuatemalaGuineaGuinea-BissauGuyanaHaitiHeavily indebted poor countries (HIPC)High incomeHondurasHong Kong SAR, ChinaHungaryIBRD onlyIcelandIDA & IBRD totalIDA blendIDA onlyIDA totalIndiaIndonesiaIran, Islamic Rep.IraqIrelandIsle of ManIsraelItalyJamaicaJapanJordanKazakhstanKenyaKiribatiKorea, Rep.KosovoKuwaitKyrgyz RepublicLao PDRLate-demographic dividendLatin America & Caribbean Latin America & Caribbean (excluding high income)Latin America & the Caribbean (IDA & IBRD countries)LatviaLeast developed countries: UN classificationLebanonLesothoLiberiaLibyaLiechtensteinLithuaniaLow & middle incomeLow incomeLower middle incomeLuxembourgMacao SAR, ChinaMacedonia, FYRMadagascarMalawiMalaysiaMaldivesMaliMaltaMarshall IslandsMauritaniaMauritiusMexicoMicronesia, Fed. Sts.Middle East & North AfricaMiddle East & North Africa (excluding high income)Middle East & North Africa (IDA & IBRD countries)Middle incomeMoldovaMonacoMongoliaMontenegroMoroccoMozambiqueMyanmarNamibiaNepalNetherlandsNew CaledoniaNew ZealandNicaraguaNigerNigeriaNorth AmericaNorwayOECD membersOmanOther small statesPacific island small statesPakistanPalauPanamaPapua New GuineaParaguayPeruPhilippinesPolandPortugalPost-demographic dividendPre-demographic dividendPuerto RicoQatarRomaniaRussian FederationRwandaSamoaSan MarinoSao Tome and PrincipeSaudi ArabiaSenegalSerbiaSeychellesSierra LeoneSingaporeSlovak RepublicSloveniaSmall statesSolomon IslandsSomaliaSouth AfricaSouth AsiaSouth Asia (IDA & IBRD)South SudanSpainSri LankaSt. Kitts and NevisSt. LuciaSt. Vincent and the GrenadinesSub-Saharan Africa Sub-Saharan Africa (excluding high income)Sub-Saharan Africa (IDA & IBRD countries)SudanSurinameSwazilandSwedenSwitzerlandSyrian Arab RepublicTajikistanTanzaniaThailandTimor-LesteTogoTongaTrinidad and TobagoTunisiaTurkeyTurkmenistanTuvaluUgandaUkraineUnited Arab EmiratesUnited KingdomUnited StatesUpper middle incomeUruguayUzbekistanVanuatuVenezuela, RBVietnamVirgin Islands (U.S.)West Bank and GazaWorldYemen, Rep.ZambiaZimbabwe Timeline:
This timeline shows a graph from 1971 to 2016 of Congo, Rep.. No data until 1970. Number of actual observations by date: 46.
Source name:
World Development Indicators
Source organization:
Estimates based on sources and methods described in "The Changing Wealth of Nations: Measuring Sustainable Development in the New Millennium" (World Bank, 2011).
Categories, topics:
Energy & Mining, Environment
Last updated:
apr 23, 2017
Indicators value changes by year
At the date of observation
Value
Absolute change
Change from previous value
jan 1, 1971
0.055
+0.055
0.0%
jan 1, 1972
0.122
+0.067
122.89%
jan 1, 1973
0.305
+0.182
149.02%
jan 1, 1974
0.743
+0.438
143.8%
jan 1, 1975
0.523
-0.219
-29.52%
jan 1, 1976
0.419
-0.104
-19.92%
jan 1, 1977
0.263
-0.156
-37.27%
jan 1, 1978
0.177
-0.086
-32.67%
jan 1, 1979
0.253
+0.076
42.82%
jan 1, 1980
0.477
+0.225
88.85%
jan 1, 1981
0.294
-0.183
-38.33%
jan 1, 1982
0.124
-0.17
-57.87%
jan 1, 1983
0.042
-0.082
-65.87%
jan 1, 1984
0.02
-0.022
-52.55%
jan 1, 1985
0.007
-0.013
-63.62%
jan 1, 1986
0.019
+0.011
154.07%
jan 1, 1987
0.024
+0.005
27.58%
jan 1, 1988
0.05
+0.026
109.09%
jan 1, 1989
0.782
+0.732
1.48K%
jan 1, 1990
0.21
-0.572
-73.13%
jan 1, 1991
0.354
+0.144
68.63%
jan 1, 1992
0.355
+0.001
0.19%
jan 1, 1993
0.071
-0.284
-80.04%
jan 1, 1994
0.078
+0.007
9.69%
jan 1, 1995
0.095
+0.017
21.64%
jan 1, 1996
0.031
-0.064
-67.23%
jan 1, 1997
0.039
+0.008
26.35%
jan 1, 1998
2.073
+2.034
5.2K%
jan 1, 1999
0.0
-2.073
-100.0%
jan 1, 2004
0.001
+0.0
140.08%
jan 1, 2005
0.009
+0.009
1.6K%
jan 1, 2006
0.007
-0.002
-25.62%
jan 1, 2007
0.011
+0.004
55.08%
jan 1, 2008
0.013
+0.002
17.23%
jan 1, 2009
0.013
+0.0
1.98%
jan 1, 2010
0.02
+0.007
55.94%
jan 1, 2011
0.034
+0.014
66.99%
jan 1, 2012
0.039
+0.005
13.87%
jan 1, 2013
0.044
+0.006
15.1%
jan 1, 2014
0.034
-0.01
-22.34%
jan 1, 2015
0.029
-0.005
-14.97%
jan 1, 2016
0.043
+0.013
45.75%
Ranking of countries by current statistics by years


Comments: