29
/
en
AIzaSyAYiBZKx7MnpbEhh9jyipgxe19OcubqV5w
April 1, 2024
105165
Chile
CHL
true
2
1
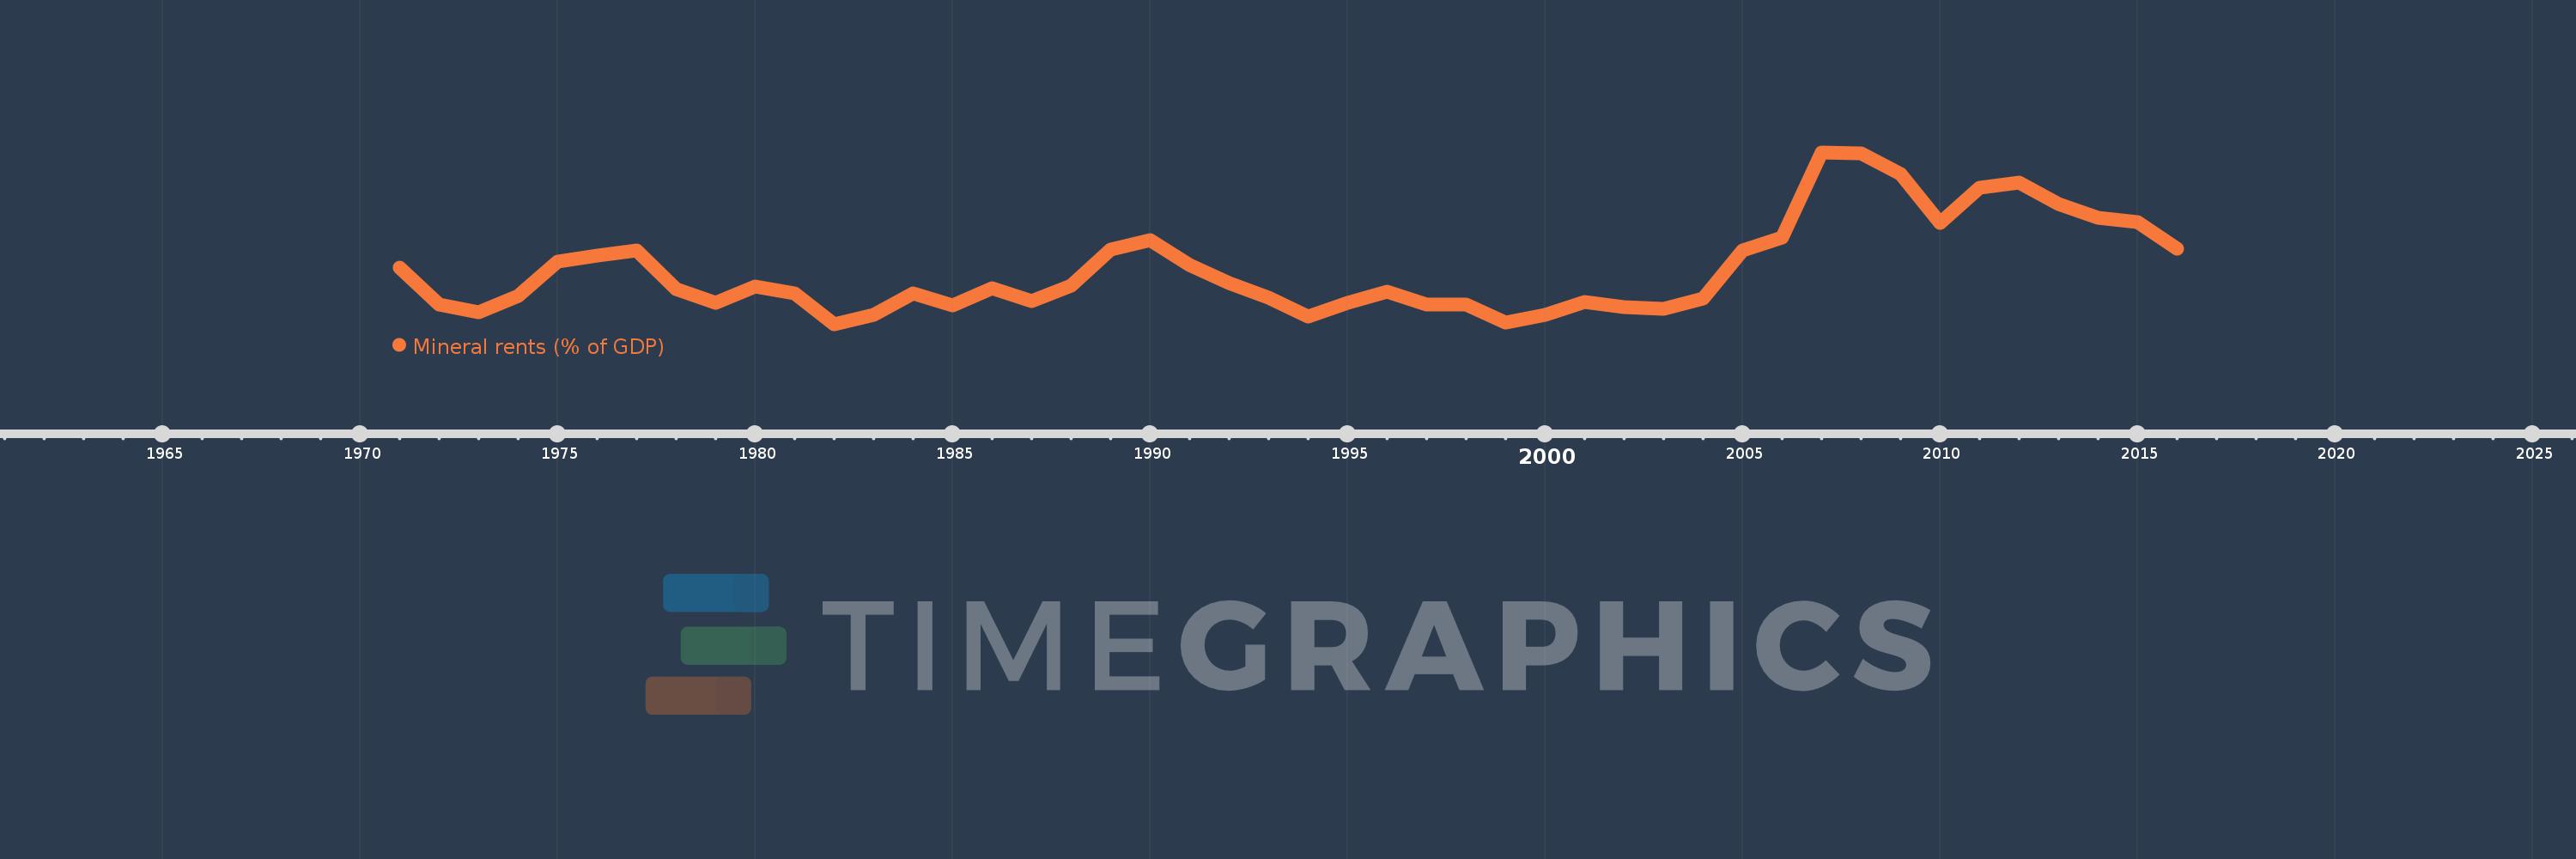
Mineral rents (% of GDP)
2016,2015,2014,2013,2012,2011,2010,2009,2008,2007,2006,2005,2004,2003,2002,2001,2000,1999,1998,1997,1996,1995,1994,1993,1992,1991,1990,1989,1988,1987,1986,1985,1984,1983,1982,1981,1980,1979,1978,1977,1976,1975,1974,1973,1972,1971
This statistics in other country:
AfghanistanAlbaniaAlgeriaAndorraAngolaAntigua and BarbudaArab WorldArgentinaArmeniaArubaAustraliaAustriaAzerbaijanBahamas, TheBahrainBangladeshBarbadosBelarusBelgiumBelizeBeninBermudaBhutanBoliviaBosnia and HerzegovinaBotswanaBrazilBrunei DarussalamBulgariaBurkina FasoBurundiCabo VerdeCambodiaCameroonCanadaCaribbean small statesCayman IslandsCentral African RepublicCentral Europe and the BalticsChadChannel IslandsChileChinaColombiaComorosCongo, Dem. Rep.Congo, Rep.Costa RicaCote d'IvoireCroatiaCubaCyprusCzech RepublicDenmarkDjiboutiDominicaDominican RepublicEarly-demographic dividendEast Asia & PacificEast Asia & Pacific (excluding high income)East Asia & Pacific (IDA & IBRD countries)EcuadorEgypt, Arab Rep.El SalvadorEquatorial GuineaEritreaEstoniaEthiopiaEuro areaEurope & Central AsiaEurope & Central Asia (excluding high income)Europe & Central Asia (IDA & IBRD countries)European UnionFaroe IslandsFijiFinlandFragile and conflict affected situationsFranceFrench PolynesiaGabonGambia, TheGeorgiaGermanyGhanaGreeceGreenlandGrenadaGuatemalaGuineaGuinea-BissauGuyanaHaitiHeavily indebted poor countries (HIPC)High incomeHondurasHong Kong SAR, ChinaHungaryIBRD onlyIcelandIDA & IBRD totalIDA blendIDA onlyIDA totalIndiaIndonesiaIran, Islamic Rep.IraqIrelandIsle of ManIsraelItalyJamaicaJapanJordanKazakhstanKenyaKiribatiKorea, Rep.KosovoKuwaitKyrgyz RepublicLao PDRLate-demographic dividendLatin America & Caribbean Latin America & Caribbean (excluding high income)Latin America & the Caribbean (IDA & IBRD countries)LatviaLeast developed countries: UN classificationLebanonLesothoLiberiaLibyaLiechtensteinLithuaniaLow & middle incomeLow incomeLower middle incomeLuxembourgMacao SAR, ChinaMacedonia, FYRMadagascarMalawiMalaysiaMaldivesMaliMaltaMarshall IslandsMauritaniaMauritiusMexicoMicronesia, Fed. Sts.Middle East & North AfricaMiddle East & North Africa (excluding high income)Middle East & North Africa (IDA & IBRD countries)Middle incomeMoldovaMonacoMongoliaMontenegroMoroccoMozambiqueMyanmarNamibiaNepalNetherlandsNew CaledoniaNew ZealandNicaraguaNigerNigeriaNorth AmericaNorwayOECD membersOmanOther small statesPacific island small statesPakistanPalauPanamaPapua New GuineaParaguayPeruPhilippinesPolandPortugalPost-demographic dividendPre-demographic dividendPuerto RicoQatarRomaniaRussian FederationRwandaSamoaSan MarinoSao Tome and PrincipeSaudi ArabiaSenegalSerbiaSeychellesSierra LeoneSingaporeSlovak RepublicSloveniaSmall statesSolomon IslandsSomaliaSouth AfricaSouth AsiaSouth Asia (IDA & IBRD)South SudanSpainSri LankaSt. Kitts and NevisSt. LuciaSt. Vincent and the GrenadinesSub-Saharan Africa Sub-Saharan Africa (excluding high income)Sub-Saharan Africa (IDA & IBRD countries)SudanSurinameSwazilandSwedenSwitzerlandSyrian Arab RepublicTajikistanTanzaniaThailandTimor-LesteTogoTongaTrinidad and TobagoTunisiaTurkeyTurkmenistanTuvaluUgandaUkraineUnited Arab EmiratesUnited KingdomUnited StatesUpper middle incomeUruguayUzbekistanVanuatuVenezuela, RBVietnamVirgin Islands (U.S.)West Bank and GazaWorldYemen, Rep.ZambiaZimbabwe Timeline:
This timeline shows a graph from 1971 to 2016 of Chile. No data until 1970. Number of actual observations by date: 46.
Source name:
World Development Indicators
Source organization:
Estimates based on sources and methods described in "The Changing Wealth of Nations: Measuring Sustainable Development in the New Millennium" (World Bank, 2011).
Categories, topics:
Energy & Mining, Environment
Last updated:
apr 23, 2017
Indicators value changes by year
Maximum:
20.962
jan 1, 2007
At the date of observation
Value
Absolute change
Change from previous value
jan 1, 1971
9.774
+9.774
0.0%
jan 1, 1972
6.171
-3.603
-36.86%
jan 1, 1973
5.385
-0.786
-12.74%
jan 1, 1974
6.989
+1.604
29.78%
jan 1, 1975
10.333
+3.344
47.85%
jan 1, 1976
10.961
+0.628
6.08%
jan 1, 1977
11.455
+0.494
4.51%
jan 1, 1978
7.658
-3.798
-33.15%
jan 1, 1979
6.313
-1.345
-17.56%
jan 1, 1980
7.95
+1.637
25.93%
jan 1, 1981
7.238
-0.712
-8.96%
jan 1, 1982
4.254
-2.984
-41.23%
jan 1, 1983
5.14
+0.887
20.84%
jan 1, 1984
7.273
+2.132
41.48%
jan 1, 1985
6.124
-1.148
-15.79%
jan 1, 1986
7.745
+1.621
26.47%
jan 1, 1987
6.466
-1.28
-16.52%
jan 1, 1988
7.977
+1.512
23.38%
jan 1, 1989
11.523
+3.546
44.45%
jan 1, 1990
12.463
+0.94
8.15%
jan 1, 1991
10.018
-2.444
-19.61%
jan 1, 1992
8.25
-1.768
-17.65%
jan 1, 1993
6.808
-1.442
-17.48%
jan 1, 1994
4.976
-1.833
-26.92%
jan 1, 1995
6.326
+1.351
27.14%
jan 1, 1996
7.396
+1.069
16.9%
jan 1, 1997
6.138
-1.257
-17.0%
jan 1, 1998
6.2
+0.062
1.02%
jan 1, 1999
4.391
-1.809
-29.18%
jan 1, 2000
5.169
+0.778
17.72%
jan 1, 2001
6.458
+1.289
24.94%
jan 1, 2002
5.939
-0.519
-8.04%
jan 1, 2003
5.731
-0.208
-3.5%
jan 1, 2004
6.787
+1.057
18.44%
jan 1, 2005
11.426
+4.638
68.34%
jan 1, 2006
12.658
+1.232
10.79%
jan 1, 2007
20.962
+8.303
65.6%
jan 1, 2008
20.833
-0.129
-0.61%
jan 1, 2009
18.86
-1.973
-9.47%
jan 1, 2010
14.096
-4.763
-25.26%
jan 1, 2011
17.508
+3.411
24.2%
jan 1, 2012
18.065
+0.558
3.19%
jan 1, 2013
15.914
-2.152
-11.91%
jan 1, 2014
14.616
-1.298
-8.15%
jan 1, 2015
14.167
-0.449
-3.08%
jan 1, 2016
11.577
-2.59
-18.28%
Ranking of countries by current statistics by years


Comments: