29
/
en
AIzaSyAYiBZKx7MnpbEhh9jyipgxe19OcubqV5w
April 1, 2024
245906
South Africa
ZAF
true
2
1
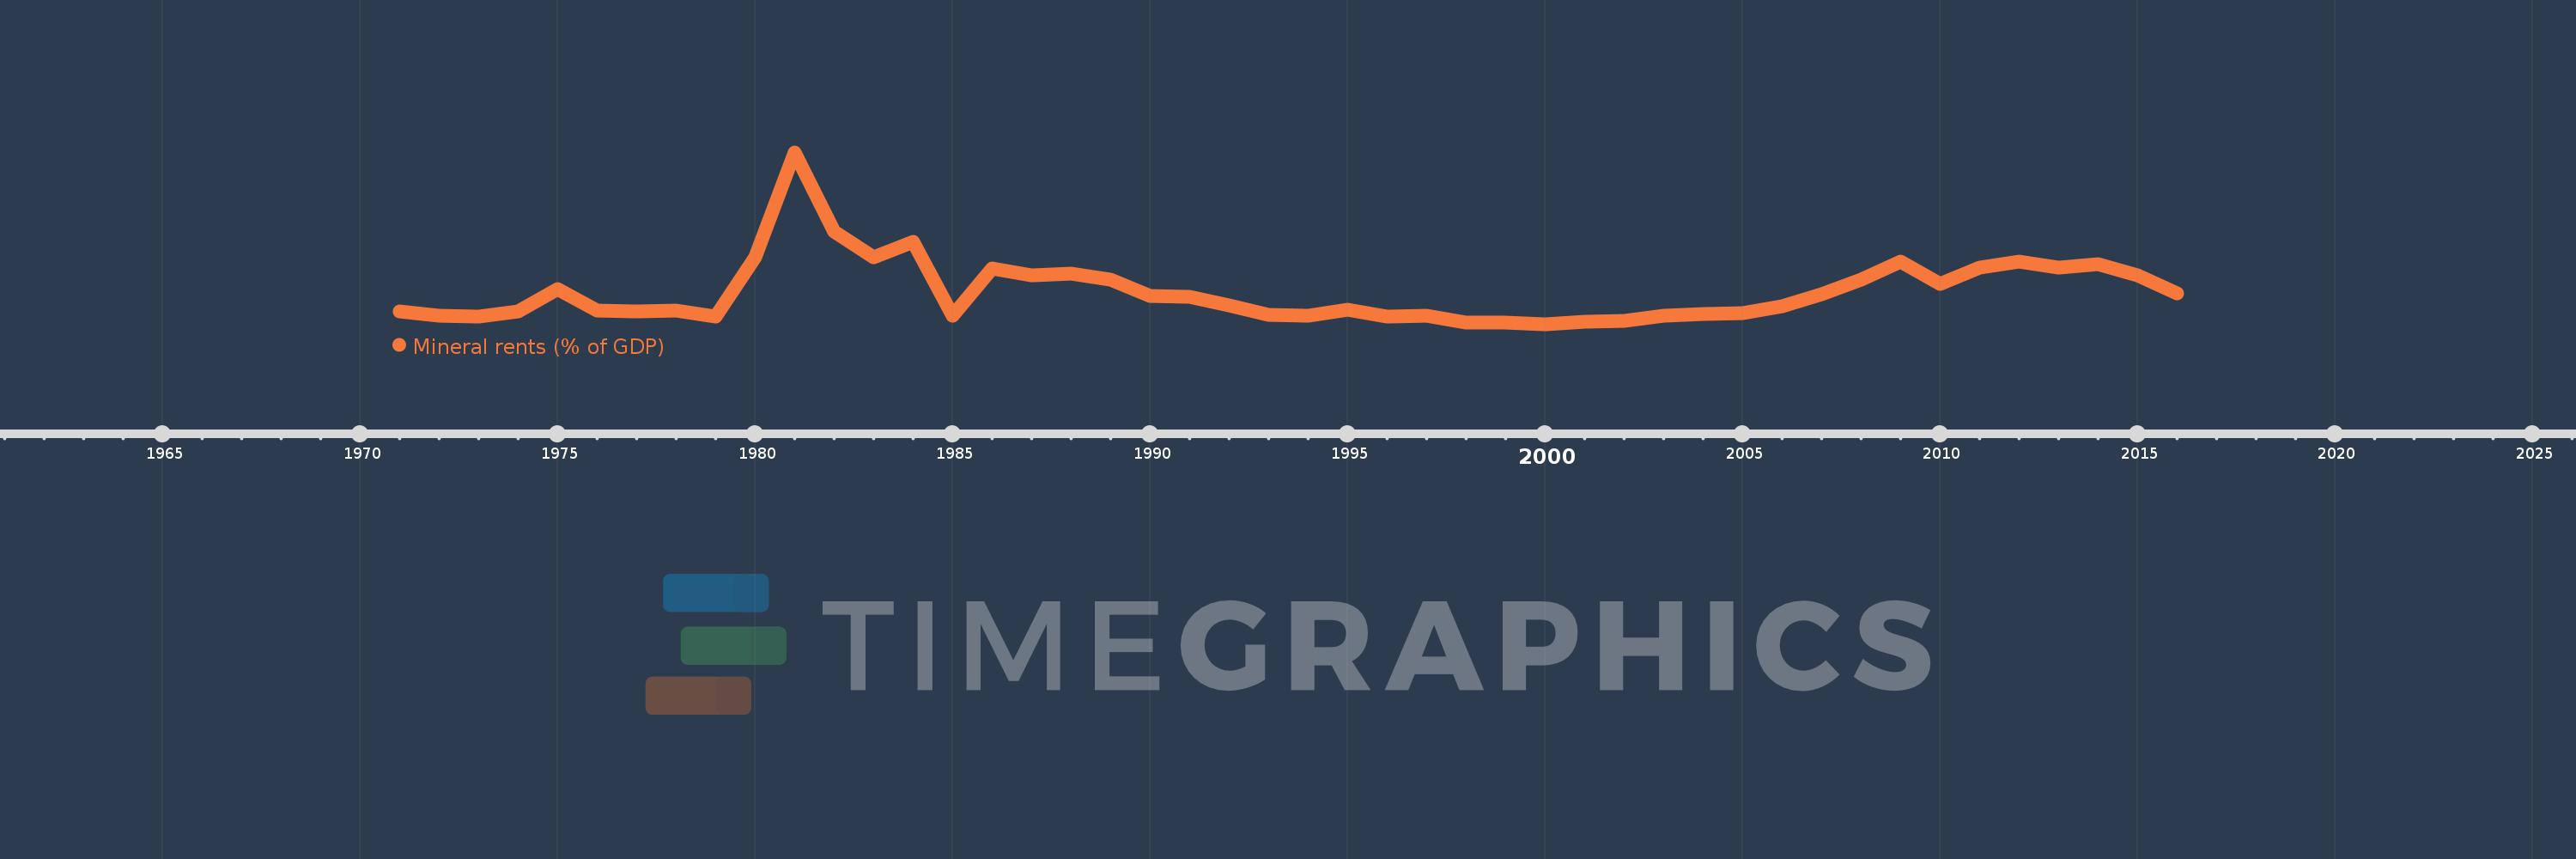
Mineral rents (% of GDP)
2016,2015,2014,2013,2012,2011,2010,2009,2008,2007,2006,2005,2004,2003,2002,2001,2000,1999,1998,1997,1996,1995,1994,1993,1992,1991,1990,1989,1988,1987,1986,1985,1984,1983,1982,1981,1980,1979,1978,1977,1976,1975,1974,1973,1972,1971
This statistics in other country:
AfghanistanAlbaniaAlgeriaAndorraAngolaAntigua and BarbudaArab WorldArgentinaArmeniaArubaAustraliaAustriaAzerbaijanBahamas, TheBahrainBangladeshBarbadosBelarusBelgiumBelizeBeninBermudaBhutanBoliviaBosnia and HerzegovinaBotswanaBrazilBrunei DarussalamBulgariaBurkina FasoBurundiCabo VerdeCambodiaCameroonCanadaCaribbean small statesCayman IslandsCentral African RepublicCentral Europe and the BalticsChadChannel IslandsChileChinaColombiaComorosCongo, Dem. Rep.Congo, Rep.Costa RicaCote d'IvoireCroatiaCubaCyprusCzech RepublicDenmarkDjiboutiDominicaDominican RepublicEarly-demographic dividendEast Asia & PacificEast Asia & Pacific (excluding high income)East Asia & Pacific (IDA & IBRD countries)EcuadorEgypt, Arab Rep.El SalvadorEquatorial GuineaEritreaEstoniaEthiopiaEuro areaEurope & Central AsiaEurope & Central Asia (excluding high income)Europe & Central Asia (IDA & IBRD countries)European UnionFaroe IslandsFijiFinlandFragile and conflict affected situationsFranceFrench PolynesiaGabonGambia, TheGeorgiaGermanyGhanaGreeceGreenlandGrenadaGuatemalaGuineaGuinea-BissauGuyanaHaitiHeavily indebted poor countries (HIPC)High incomeHondurasHong Kong SAR, ChinaHungaryIBRD onlyIcelandIDA & IBRD totalIDA blendIDA onlyIDA totalIndiaIndonesiaIran, Islamic Rep.IraqIrelandIsle of ManIsraelItalyJamaicaJapanJordanKazakhstanKenyaKiribatiKorea, Rep.KosovoKuwaitKyrgyz RepublicLao PDRLate-demographic dividendLatin America & Caribbean Latin America & Caribbean (excluding high income)Latin America & the Caribbean (IDA & IBRD countries)LatviaLeast developed countries: UN classificationLebanonLesothoLiberiaLibyaLiechtensteinLithuaniaLow & middle incomeLow incomeLower middle incomeLuxembourgMacao SAR, ChinaMacedonia, FYRMadagascarMalawiMalaysiaMaldivesMaliMaltaMarshall IslandsMauritaniaMauritiusMexicoMicronesia, Fed. Sts.Middle East & North AfricaMiddle East & North Africa (excluding high income)Middle East & North Africa (IDA & IBRD countries)Middle incomeMoldovaMonacoMongoliaMontenegroMoroccoMozambiqueMyanmarNamibiaNepalNetherlandsNew CaledoniaNew ZealandNicaraguaNigerNigeriaNorth AmericaNorwayOECD membersOmanOther small statesPacific island small statesPakistanPalauPanamaPapua New GuineaParaguayPeruPhilippinesPolandPortugalPost-demographic dividendPre-demographic dividendPuerto RicoQatarRomaniaRussian FederationRwandaSamoaSan MarinoSao Tome and PrincipeSaudi ArabiaSenegalSerbiaSeychellesSierra LeoneSingaporeSlovak RepublicSloveniaSmall statesSolomon IslandsSomaliaSouth AfricaSouth AsiaSouth Asia (IDA & IBRD)South SudanSpainSri LankaSt. Kitts and NevisSt. LuciaSt. Vincent and the GrenadinesSub-Saharan Africa Sub-Saharan Africa (excluding high income)Sub-Saharan Africa (IDA & IBRD countries)SudanSurinameSwazilandSwedenSwitzerlandSyrian Arab RepublicTajikistanTanzaniaThailandTimor-LesteTogoTongaTrinidad and TobagoTunisiaTurkeyTurkmenistanTuvaluUgandaUkraineUnited Arab EmiratesUnited KingdomUnited StatesUpper middle incomeUruguayUzbekistanVanuatuVenezuela, RBVietnamVirgin Islands (U.S.)West Bank and GazaWorldYemen, Rep.ZambiaZimbabwe Timeline:
This timeline shows a graph from 1971 to 2016 of South Africa. No data until 1970. Number of actual observations by date: 46.
Source name:
World Development Indicators
Source organization:
Estimates based on sources and methods described in "The Changing Wealth of Nations: Measuring Sustainable Development in the New Millennium" (World Bank, 2011).
Categories, topics:
Energy & Mining, Environment
Last updated:
apr 23, 2017
Indicators value changes by year
Maximum:
10.661
jan 1, 1981
At the date of observation
Value
Absolute change
Change from previous value
jan 1, 1971
1.106
+1.106
0.0%
jan 1, 1972
0.826
-0.28
-25.28%
jan 1, 1973
0.786
-0.041
-4.92%
jan 1, 1974
1.058
+0.273
34.71%
jan 1, 1975
2.43
+1.372
129.63%
jan 1, 1976
1.13
-1.3
-53.5%
jan 1, 1977
1.098
-0.032
-2.79%
jan 1, 1978
1.129
+0.031
2.79%
jan 1, 1979
0.75
-0.379
-33.61%
jan 1, 1980
4.329
+3.58
477.5%
jan 1, 1981
10.661
+6.331
146.24%
jan 1, 1982
5.89
-4.77
-44.75%
jan 1, 1983
4.321
-1.569
-26.64%
jan 1, 1984
5.293
+0.972
22.5%
jan 1, 1985
0.824
-4.47
-84.44%
jan 1, 1986
3.648
+2.824
342.86%
jan 1, 1987
3.237
-0.411
-11.27%
jan 1, 1988
3.363
+0.127
3.91%
jan 1, 1989
2.973
-0.391
-11.62%
jan 1, 1990
2.006
-0.966
-32.5%
jan 1, 1991
1.936
-0.071
-3.52%
jan 1, 1992
1.418
-0.518
-26.73%
jan 1, 1993
0.896
-0.522
-36.83%
jan 1, 1994
0.802
-0.094
-10.53%
jan 1, 1995
1.209
+0.407
50.8%
jan 1, 1996
0.757
-0.452
-37.39%
jan 1, 1997
0.828
+0.072
9.45%
jan 1, 1998
0.4
-0.428
-51.67%
jan 1, 1999
0.418
+0.018
4.48%
jan 1, 2000
0.309
-0.109
-26.15%
jan 1, 2001
0.465
+0.156
50.61%
jan 1, 2002
0.487
+0.021
4.58%
jan 1, 2003
0.822
+0.336
68.97%
jan 1, 2004
0.903
+0.081
9.81%
jan 1, 2005
0.977
+0.074
8.17%
jan 1, 2006
1.373
+0.396
40.6%
jan 1, 2007
2.12
+0.747
54.37%
jan 1, 2008
3.0
+0.88
41.54%
jan 1, 2009
4.083
+1.082
36.08%
jan 1, 2010
2.739
-1.344
-32.91%
jan 1, 2011
3.729
+0.991
36.17%
jan 1, 2012
4.079
+0.35
9.37%
jan 1, 2013
3.725
-0.354
-8.67%
jan 1, 2014
3.925
+0.2
5.36%
jan 1, 2015
3.255
-0.67
-17.06%
jan 1, 2016
2.192
-1.064
-32.67%
Ranking of countries by current statistics by years


Comments: