29
/
en
AIzaSyAYiBZKx7MnpbEhh9jyipgxe19OcubqV5w
April 1, 2024
156303
Indonesia
IDN
true
2
1
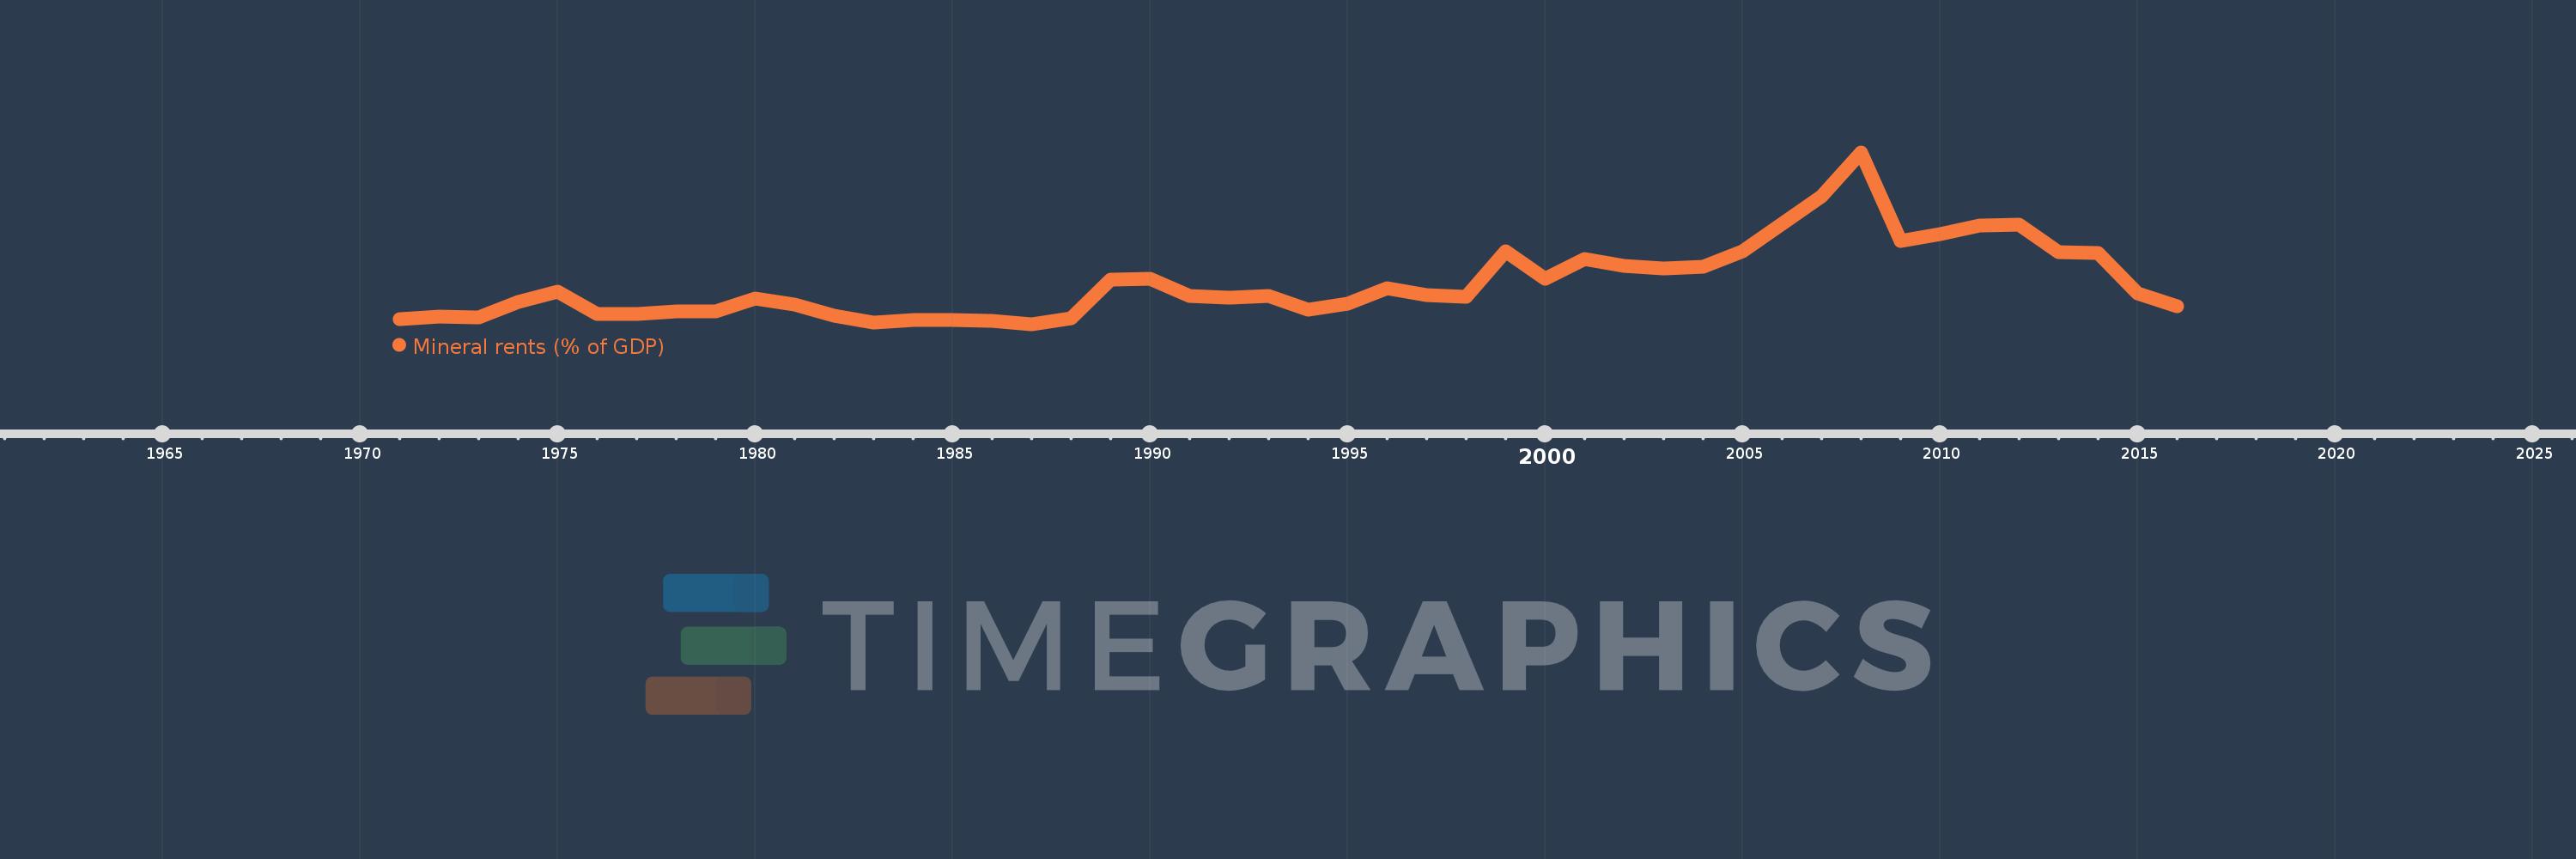
Mineral rents (% of GDP)
2016,2015,2014,2013,2012,2011,2010,2009,2008,2007,2006,2005,2004,2003,2002,2001,2000,1999,1998,1997,1996,1995,1994,1993,1992,1991,1990,1989,1988,1987,1986,1985,1984,1983,1982,1981,1980,1979,1978,1977,1976,1975,1974,1973,1972,1971
This statistics in other country:
AfghanistanAlbaniaAlgeriaAndorraAngolaAntigua and BarbudaArab WorldArgentinaArmeniaArubaAustraliaAustriaAzerbaijanBahamas, TheBahrainBangladeshBarbadosBelarusBelgiumBelizeBeninBermudaBhutanBoliviaBosnia and HerzegovinaBotswanaBrazilBrunei DarussalamBulgariaBurkina FasoBurundiCabo VerdeCambodiaCameroonCanadaCaribbean small statesCayman IslandsCentral African RepublicCentral Europe and the BalticsChadChannel IslandsChileChinaColombiaComorosCongo, Dem. Rep.Congo, Rep.Costa RicaCote d'IvoireCroatiaCubaCyprusCzech RepublicDenmarkDjiboutiDominicaDominican RepublicEarly-demographic dividendEast Asia & PacificEast Asia & Pacific (excluding high income)East Asia & Pacific (IDA & IBRD countries)EcuadorEgypt, Arab Rep.El SalvadorEquatorial GuineaEritreaEstoniaEthiopiaEuro areaEurope & Central AsiaEurope & Central Asia (excluding high income)Europe & Central Asia (IDA & IBRD countries)European UnionFaroe IslandsFijiFinlandFragile and conflict affected situationsFranceFrench PolynesiaGabonGambia, TheGeorgiaGermanyGhanaGreeceGreenlandGrenadaGuatemalaGuineaGuinea-BissauGuyanaHaitiHeavily indebted poor countries (HIPC)High incomeHondurasHong Kong SAR, ChinaHungaryIBRD onlyIcelandIDA & IBRD totalIDA blendIDA onlyIDA totalIndiaIndonesiaIran, Islamic Rep.IraqIrelandIsle of ManIsraelItalyJamaicaJapanJordanKazakhstanKenyaKiribatiKorea, Rep.KosovoKuwaitKyrgyz RepublicLao PDRLate-demographic dividendLatin America & Caribbean Latin America & Caribbean (excluding high income)Latin America & the Caribbean (IDA & IBRD countries)LatviaLeast developed countries: UN classificationLebanonLesothoLiberiaLibyaLiechtensteinLithuaniaLow & middle incomeLow incomeLower middle incomeLuxembourgMacao SAR, ChinaMacedonia, FYRMadagascarMalawiMalaysiaMaldivesMaliMaltaMarshall IslandsMauritaniaMauritiusMexicoMicronesia, Fed. Sts.Middle East & North AfricaMiddle East & North Africa (excluding high income)Middle East & North Africa (IDA & IBRD countries)Middle incomeMoldovaMonacoMongoliaMontenegroMoroccoMozambiqueMyanmarNamibiaNepalNetherlandsNew CaledoniaNew ZealandNicaraguaNigerNigeriaNorth AmericaNorwayOECD membersOmanOther small statesPacific island small statesPakistanPalauPanamaPapua New GuineaParaguayPeruPhilippinesPolandPortugalPost-demographic dividendPre-demographic dividendPuerto RicoQatarRomaniaRussian FederationRwandaSamoaSan MarinoSao Tome and PrincipeSaudi ArabiaSenegalSerbiaSeychellesSierra LeoneSingaporeSlovak RepublicSloveniaSmall statesSolomon IslandsSomaliaSouth AfricaSouth AsiaSouth Asia (IDA & IBRD)South SudanSpainSri LankaSt. Kitts and NevisSt. LuciaSt. Vincent and the GrenadinesSub-Saharan Africa Sub-Saharan Africa (excluding high income)Sub-Saharan Africa (IDA & IBRD countries)SudanSurinameSwazilandSwedenSwitzerlandSyrian Arab RepublicTajikistanTanzaniaThailandTimor-LesteTogoTongaTrinidad and TobagoTunisiaTurkeyTurkmenistanTuvaluUgandaUkraineUnited Arab EmiratesUnited KingdomUnited StatesUpper middle incomeUruguayUzbekistanVanuatuVenezuela, RBVietnamVirgin Islands (U.S.)West Bank and GazaWorldYemen, Rep.ZambiaZimbabwe Timeline:
This timeline shows a graph from 1971 to 2016 of Indonesia. No data until 1970. Number of actual observations by date: 46.
Source name:
World Development Indicators
Source organization:
Estimates based on sources and methods described in "The Changing Wealth of Nations: Measuring Sustainable Development in the New Millennium" (World Bank, 2011).
Categories, topics:
Energy & Mining, Environment
Last updated:
apr 23, 2017
Indicators value changes by year
At the date of observation
Value
Absolute change
Change from previous value
jan 1, 1971
0.275
+0.275
0.0%
jan 1, 1972
0.328
+0.053
19.37%
jan 1, 1973
0.315
-0.013
-3.82%
jan 1, 1974
0.596
+0.281
89.0%
jan 1, 1975
0.794
+0.198
33.24%
jan 1, 1976
0.382
-0.412
-51.9%
jan 1, 1977
0.374
-0.008
-2.1%
jan 1, 1978
0.428
+0.054
14.38%
jan 1, 1979
0.424
-0.004
-0.87%
jan 1, 1980
0.667
+0.243
57.35%
jan 1, 1981
0.55
-0.117
-17.53%
jan 1, 1982
0.34
-0.21
-38.15%
jan 1, 1983
0.226
-0.114
-33.47%
jan 1, 1984
0.264
+0.038
16.62%
jan 1, 1985
0.262
-0.002
-0.88%
jan 1, 1986
0.254
-0.007
-2.84%
jan 1, 1987
0.188
-0.066
-26.14%
jan 1, 1988
0.291
+0.103
54.96%
jan 1, 1989
1.025
+0.734
252.25%
jan 1, 1990
1.037
+0.013
1.25%
jan 1, 1991
0.713
-0.325
-31.31%
jan 1, 1992
0.676
-0.037
-5.12%
jan 1, 1993
0.721
+0.045
6.6%
jan 1, 1994
0.464
-0.256
-35.57%
jan 1, 1995
0.578
+0.114
24.47%
jan 1, 1996
0.859
+0.281
48.64%
jan 1, 1997
0.725
-0.134
-15.61%
jan 1, 1998
0.706
-0.019
-2.62%
jan 1, 1999
1.548
+0.842
119.21%
jan 1, 2000
1.033
-0.515
-33.28%
jan 1, 2001
1.401
+0.368
35.61%
jan 1, 2002
1.268
-0.132
-9.44%
jan 1, 2003
1.22
-0.048
-3.82%
jan 1, 2004
1.253
+0.033
2.74%
jan 1, 2005
1.545
+0.292
23.29%
jan 1, 2006
2.056
+0.511
33.07%
jan 1, 2007
2.577
+0.52
25.3%
jan 1, 2008
3.391
+0.814
31.6%
jan 1, 2009
1.741
-1.65
-48.66%
jan 1, 2010
1.874
+0.133
7.66%
jan 1, 2011
2.023
+0.149
7.95%
jan 1, 2012
2.05
+0.026
1.31%
jan 1, 2013
1.531
-0.519
-25.33%
jan 1, 2014
1.522
-0.009
-0.59%
jan 1, 2015
0.764
-0.758
-49.79%
jan 1, 2016
0.525
-0.239
-31.27%
Ranking of countries by current statistics by years


Comments: